Category: Frugal analytics
All blog posts in this category.
- 16 Feb, 2026
Cookieless 2026: why SMEs can move faster when analytics stays small
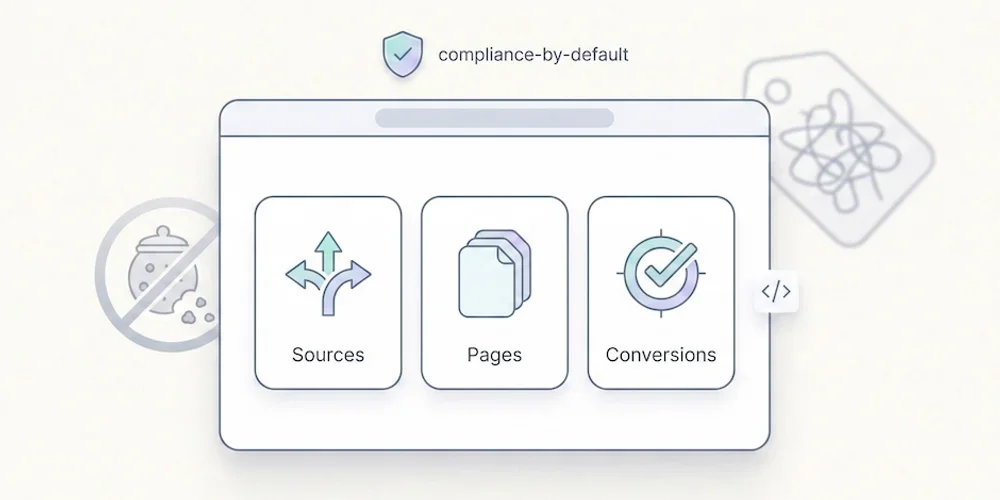
Large organizations often need months to change analytics tools. They have tag managers, consent platforms, data warehouses, agency workflows, advertising pixels, dashboards and historical reporting commitments. SMEs usually have less legacy. That can be an advantage if they keep the migration disciplined. Cookieless analytics is not magic. It is a product and governance choice: collect less, document more clearly, and focus on reports the team actually reads. Why SMEs can move faster SMEs usually have fewer stakeholders, fewer custom tags and fewer legacy dashboards. A small team can audit its measurement stack in a day, remove unnecessary scripts and agree on a simpler reporting model. The advantage is not size by itself. The advantage is decision speed. A founder, marketing lead, product manager and developer can sit together and decide what is genuinely needed for launch. The practical playbook Start with four questions:Which decisions will analytics support each week? Which fields are necessary for those decisions? Which fields belong only in enriched collection? Who owns future changes to the tracking plan?Then implement the simplest baseline possible. Page views, sources, top content, key actions and trend comparison are enough for many SME sites. Campaign details, advanced goals, technical slices and multi-site segmentation should be added deliberately when they create real value. What to avoid Avoid rebuilding the complexity you were trying to escape:installing multiple analytics scripts for the same question; keeping old pixels "just in case"; collecting campaign parameters nobody reviews; adding custom events before the team has defined success; presenting privacy posture as a generic guarantee instead of documenting the setup.Where Pomelo fits Pomelo's launch doctrine is Strict by default and Extended by configuration. That fits SMEs that want useful reporting without expanding the tracking stack unnecessarily; compliance still depends on the site's documented configuration. Strict should answer the baseline questions. Extended should be reserved for richer acquisition, events, goals and technical context. The setting belongs in site collection settings, not inside reports. Sources Sources checked on May 9, 2026.CNIL, Cookies and audience measurement solutions CNIL, Cookies and other trackers Google, Consent Mode overview Pomelo, GDPR audience measurement framework article
- 05 Jan, 2026
Why the Era of 'Data Obesity' Is Paralyzing Small Businesses (And How to Break Free)
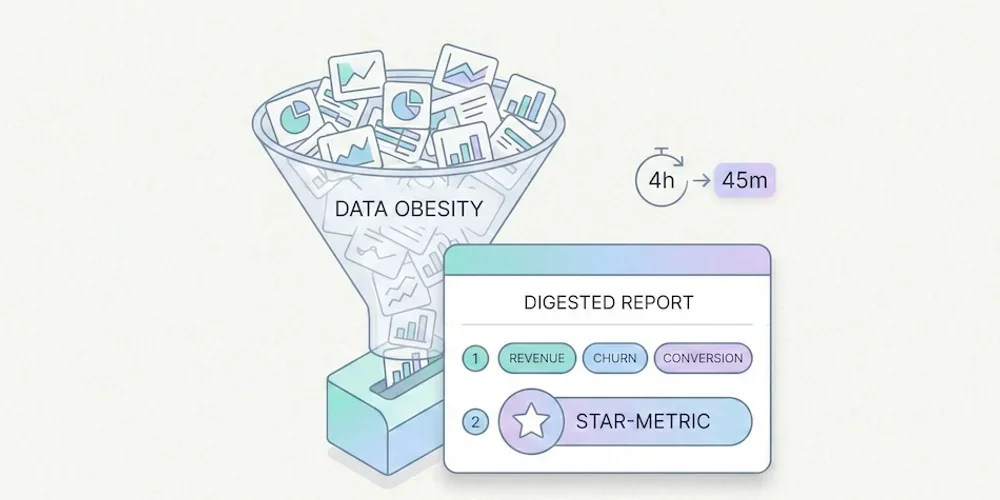
We were sold a dream. The "Big Data" dream. For the past decade, the promise made to SMB owners, SaaS teams, and marketing managers has been the same: "The more data you collect about your visitors, the better you'll sell." The reality in 2025? It's often the opposite. Tools have become bloated, data piles up unread, and decisions are slower than before. This is what we call data obesity: the accumulation of data that doesn't serve decisions, but costs you in time, money, compliance, and performance. In short:Too much data kills decisions: information overload clutters dashboards and paralyzes action. The "Vanity Metrics" trap: you track flattering curves instead of focusing on what actually drives revenue. A triple cost: technical (slower site), legal (GDPR), and trust (visitors refusing tracking). The solution exists: frugal analytics — measure less, decide better.1. The "Dashboard Nobody Looks At" Syndrome Open your current analytics tool. In under 10 seconds, can you tell:whether your week was good? which page generated the most leads? which traffic source is performing best?If the answer is no, you're not alone. You're in the overwhelming majority. Big Data Isn't for SMBs Eurostat's Digitalisation in Europe publication frames advanced digital adoption as a 2030 objective: 75% of EU companies should use cloud computing, perform big data analysis, or use artificial intelligence. The same source shows the gap by company size: in 2022, 98% of large businesses reached a basic level of digital intensity, versus 69% of SMEs. → Source: Eurostat – Digitalisation in Europe, technology uptake in businesses Yet these same SMBs end up with tools designed for 20-person data teams. GA4 offers hundreds of reports, dozens of dimensions, customizable explorations. For a 2-person marketing team, it's like getting an airliner cockpit when all you need is a car dashboard. The Choice That Paralyzes The abundance of options, reports, and dimensions creates user fatigue. This is a well-documented phenomenon in behavioral science: choice overload. The more options you have, the less capable you are of choosing — and the less satisfied you are with your choice when you make one. → Source: The Decision Lab – Choice Overload Bias Applied to analytics: more information ≠ better decisions. On the contrary, too much data leads to inaction. You close the tab and fly blind.2. The Race for "Vanity Metrics" In many small businesses, the metrics sitting at the top of dashboards are also the ones least useful for decision-making:pageviews (without knowing which pages convert), total session count (without distinguishing prospects from bots), bounce rate (an ambiguous metric, often misinterpreted), visitors by country (rarely actionable for a local business).These metrics flatter the ego — "we had 10,000 visits this month!" — but they say nothing about a site's actual performance. The 3-Question Test For a small business, a useful dashboard should answer three questions:How many people are discovering my site? (acquisition) Which pages generate the most inquiries or sales? (performance) What does that represent each week? (results)If your tool can't answer these immediately, it's pulling you away from your main goal: understanding what works so you can grow your business. We've detailed which metrics to keep (and which to ignore) in our guide to The "5 KPIs" Method.3. The Hidden Cost of Complexity Data obesity doesn't just cost time. It has three concrete costs that most businesses underestimate. 3.1 The Technical Cost: A Slower Website Traditional analytics tools often ship heavy scripts that degrade Core Web Vitals — the web performance metrics Google uses as a ranking factor. An independent audit by Bejamas shows that third-party scripts (analytics, chat widgets, marketing pixels) can significantly slow down page loads, with analytics scripts often leading in main-thread blocking time. → Source: Bejamas – How Popular Scripts Slow Down Your Website The GA4 script weighs approximately 45 KB compressed in the cited measurements. Frugal alternatives often sit between 1 and 6 KB. As we explain in our article on SEO without Google Analytics, lighter third-party scripts can contribute to better Core Web Vitals, even though the result always depends on the full page. Slower sites = fewer conversions = less revenue. 3.2 The Legal Cost: GDPR Risk The more signals you collect — precise geolocation, cross-page navigation, technical fingerprinting, per-page session duration — the higher your legal exposure. Every piece of data collected is a piece of data to protect, to document in your processing registry, and to justify during an audit. European Data Protection Authorities — including the French CNIL — describe a narrow path for audience measurement tools that meet strict conditions. The practical lesson is not "no banner by default"; it is that minimal collection, clear documentation, and a correctly configured tool reduce compliance burden. → Source: CNIL – Audience measurement solutions This is probably the most underappreciated argument for frugal analytics: collecting less reduces the surface you need to document and can simplify review. It does not remove the need to assess purposes, visitor information, possible consent requirements, or the other trackers on the same site. For the formal criteria, use the CNIL page and document your own configuration. 3.3 The Trust Cost: Visitors Who Refuse Another side effect of traditional analytics: cookie banners. According to data from European regulators, cookie refusal rates have risen significantly since enforcement began in earnest. Depending on consent rates, browsers, blockers, geography and the broader tracker stack, a classic cookie-banner setup can materially reduce measured traffic. → Source: CNIL – Cookie action plan impact evaluation In some sectors, ad blockers and script blockers amplify the gap further. Result: your dashboard can under-represent part of the measurable audience. The size of that gap is context-specific. A cookieless-by-default tool reduces dependence on acceptance rates for the audience-measurement layer. Your final consent UI still depends on the full tracker stack, including advertising pixels, personalization, or session replay.4. The Solution: Frugal Analytics Frugal analytics isn't about measuring less out of laziness or ideology. It's about measuring better, by focusing on what:concretely helps you make decisions, respects visitor privacy, doesn't slow down your site, limits some legal-review friction.What It Changes in PracticeBefore (Data Obesity) After (Frugal Analytics)200+ metrics available 5-7 actionable KPIsDashboard opened once a month (and closed immediately) Dashboard checked weekly, understood in 30 secondsConsent UI driven by broad tracker stack Cookieless-by-default audience baselineHeavy script, possible Core Web Vitals impact Lighter script, impact to measure in contextComplex GDPR compliance (CMP, registry, proxying) Minimal collection and more readable review40-page monthly report 10-line results-oriented reportFrugal analytics is the equivalent of seasonal cooking: fewer ingredients, better chosen, better prepared. The result is superior to accumulation. The Core PrinciplesCollect only what drives decisions. If a data point wouldn't change your actions, don't collect it. Simplify to democratize. A dashboard the founder understands is worth more than a report only the data analyst can interpret. Respect by design. Compliance shouldn't be a bolt-on ("let's proxy GA4 to reduce risk") but a prerequisite: choose collection boundaries that are clear, minimal and documentable. Measure performance, not people. Aggregated trends (popular pages, traffic sources, conversion rates) are more useful and less risky than individual-level tracking.5. Where to Start If you're convinced your current analytics is too complex, here are the first three steps. Step 1: Identify your 5 KPIs. Use the 5 KPIs method to define the only metrics that matter for your business. If an indicator doesn't pass the test "would I change how I work if this number moved?", remove it. Step 2: Evaluate your current tool. Compare it honestly against the alternatives. Our analytics tool comparison details the strengths, weaknesses, and pricing of each family (GA4, Matomo, frugal). Step 3: Test. Most frugal solutions install quickly with a short script and offer a free trial. Run both tools in parallel for a month. Compare: which one gives you an answer faster?Conclusion: Put Your Analytics on a Diet The era of collecting data "just in case" is behind us. Regulation, web performance, and common sense all converge on the same conclusion: less data, better chosen, is better for everyone — for the business, for visitors, and for the web. For 2026, the best strategy for an SMB isn't adding dashboards — it's removing them. Less noise. Less friction. More concrete decisions. Frugal analytics means putting data in service of the business, not the other way around.FAQ: Understanding Frugal Analytics What is frugal analytics? An approach to audience measurement that limits collection to the strict minimum needed to make business decisions. It's built on three principles: collect only what drives action, prefer aggregated data over individual profiles, and choose tools with clear collection boundaries (no measurement cookies, no user profiles). Which metrics should I absolutely keep? Unique visitors, traffic sources, top pages, key events (CTA clicks, form submissions), and conversions. These 5 metrics are enough to steer a brochure site, a blog, or a small e-commerce store. Everything else is bonus — or noise. Can you do frugal analytics with GA4? Technically yes, but it requires advanced expertise: disabling granular collection, configuring consent mode, reducing some transfer or collection risks, and building custom reports limited to essential KPIs. For most SMBs, it is simpler to choose a natively frugal tool and then document the actual setup. Is frugal analytics enough for e-commerce? For a small e-commerce site (under 1,000 orders/month), yes. The 5 essential KPIs cover acquisition, engagement, and conversion. For e-commerce with multi-channel attribution, retargeting, or advanced segmentation needs, a more comprehensive tool (Matomo, GA4) will be necessary — but the frugality principle still applies: start with the essentials, and add complexity only if it's justified. How many businesses actually use Big Data? Eurostat's Digitalisation in Europe data shows a persistent size gap in digital intensity: in 2022, 98% of large businesses reached a basic level, versus 69% of SMEs. Most small teams do not have the people, tools, or need to exploit massive datasets. Frugal analytics is the approach suited to this reality. SourcesEurostat, Digitalisation in Europe: technology uptake in businesses CNIL, Cookies: audience measurement solutions CNIL, Cookie action plan impact evaluation Google Search Central, Core Web Vitals and Google Search results