Blog: Privacy, GDPR & Audience Measurement
Guides and analysis on GDPR compliance, privacy-first analytics, SEO measurement, and audience tracking for modern websites.
Google removed FAQ rich results: should you still add FAQs to articles?
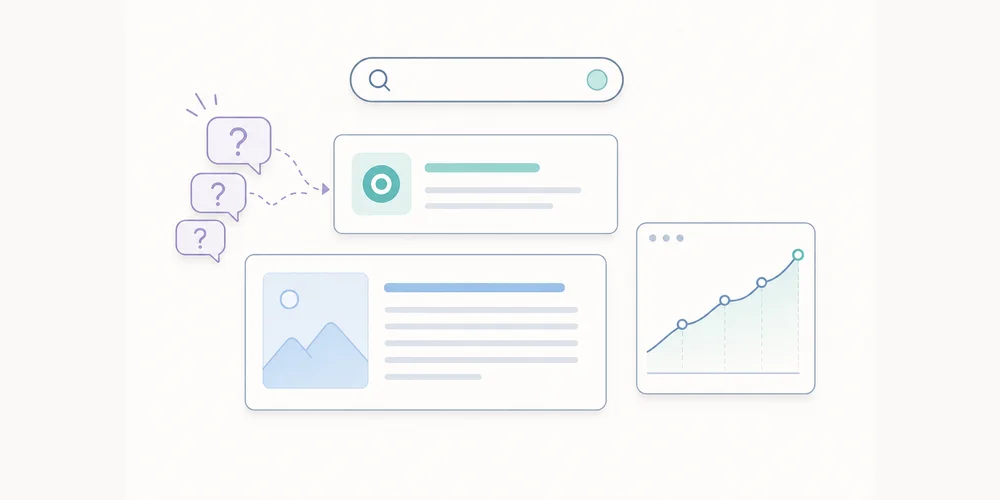
For years, many sites added FAQ blocks to the end of articles in the hope of earning a rich result in Google Search. That tactic gradually lost value, and Google made a clear change in 2026: FAQ rich results no longer appear in Search starting 7 May 2026, and the related documentation was later removed. Does that mean every FAQ should disappear? No. But FAQs should no longer be treated as a shortcut to search visibility. An FAQ can still be useful if it answers real objections, clarifies a complex topic, improves navigation or turns a long article into a more usable resource. It is less useful when it repeats the article, stacks artificial questions or exists only to occupy more SERP space. What Google changed In its Search Central changelog, Google states that the FAQ rich result feature no longer appears in Google Search starting 7 May 2026. In June, Google also removed the documentation associated with that feature. The Search Console data anomalies page also notes that the disappearance of this appearance can cause a drop in impressions associated with FAQ rich results. This matters for reporting: a fall in FAQ appearance impressions does not necessarily mean that pages lost overall organic audience. In other words, if a report shows a break in FAQ appearance data, the first hypothesis is not a penalty or a quality drop. It is likely an interface and reporting change. FAQs should no longer be written for the rich result The issue was never the FAQ format itself. The issue was the mechanical use of the format. Examples of weak practices include:repeating the title as a question; adding five generic questions with no new information; hiding keyword variants in artificial answers; writing answers that are too short to be useful; reusing the same FAQ across several articles; making markup the main purpose of the block.With FAQ rich results gone, those tactics lose their tactical justification. They remain bad for the reader experience. Good reasons to keep an FAQ An FAQ remains relevant when it has a clear editorial function. Clarifying limits On privacy, compliance and analytics topics, an FAQ can answer questions that should not interrupt the main article. Examples:“Does cookieless mean no consent is needed?” “Is aggregated data always anonymous?” “Is a Search Console report a measure of sessions?”These answers can prevent misunderstandings without making the article heavier. Addressing objections A reader may understand the article and still have a practical objection: cost, complexity, DPO involvement, loss of data or reporting impact. A good FAQ addresses these objections directly. Improving navigation In a long guide, an FAQ can act as a shortcut. It helps a busy reader find the answer to a common question quickly. Making the article more reusable A well-written FAQ makes an article easier to quote, share or turn into internal guidance. It can also feed a knowledge base or sales enablement brief without changing the core content. When to remove or rewrite an FAQ Remove the FAQ if every answer repeats an existing section. It should not become a second conclusion. Rewrite it if the questions are disguised keywords. A useful question sounds like a real reader hesitation, not a search query with a question mark. Merge it if several questions receive the same answer. That is often a sign that the article needs a better summary section, not an FAQ block. Keep it if it adds precision, caution or action. In privacy-first content, FAQs are especially useful for avoiding overly broad compliance claims. FAQ structured data: what now? The end of a rich result does not mean all structured data is useless everywhere. But for FAQs, the goal should no longer be to win an appearance that Google Search has removed. A practical rule:visible content should remain written for readers; markup should not promise a display that no longer exists; teams should avoid maintaining code only for a retired feature; changes should be tested on a sample before a large cleanup.If your CMS or theme automatically adds FAQ markup, check whether it still creates technical debt: testing errors, inconsistencies between visible text and markup, maintenance overhead, or internal reports that no longer matter. How to adapt SEO reporting Teams that tracked FAQ impressions should change their dashboards. Keep tracking:organic clicks by page; total web impressions; average position, interpreted carefully; main queries; conversions or useful actions on site; performance of articles that contain FAQs, independently from the old appearance.Remove or annotate:targets for FAQ rich result impressions; unannotated 2025/2026 comparisons; reports attributing a drop in FAQ appearance to content decline; automatic recommendations such as “add an FAQ to win more space in Google”.When a display format disappears, reports should be annotated, especially when non-SEO teams read the dashboard. FAQs in generative search Google says SEO best practices remain relevant for its generative AI features. Helpful, original and non-commodity content remains the foundation. Google also says there is no special markup to add for appearing in generative AI features in Search. This reinforces a simple idea: FAQs should not be treated as a visibility hack. They should make content clearer, more verifiable and more useful. A well-written FAQ can improve understanding of a complex topic. An artificial FAQ does not become more valuable in a generative interface than it was in classic search results. A page-by-page decision method For each article with a FAQ, ask five questions:Does the FAQ answer questions the article body does not address clearly? Do the answers add nuance, limits or action? Are the questions phrased like real reader questions? Does the block improve mobile reading? Is maintaining the markup still justified?If the answer is no to three or more questions, the FAQ should be removed or rewritten. Conclusion The end of FAQ rich results is not the end of editorial FAQs. It ends a bad incentive: adding FAQ blocks only to take up more space in Google. For analytics, SEO and privacy content, FAQs remain useful when they serve understanding. They should clarify, reduce misunderstandings, answer objections and make the article more actionable. The right decision is not to keep or remove every FAQ. The right decision is to treat FAQs as an editorial component, not a SERP shortcut. SourcesGoogle Search Central - Latest documentation updates Google Search Central - Search Console data anomalies Google Search Central - A new resource for optimizing for generative AI in Google Search Google Search Central - AI features and your website
Read article →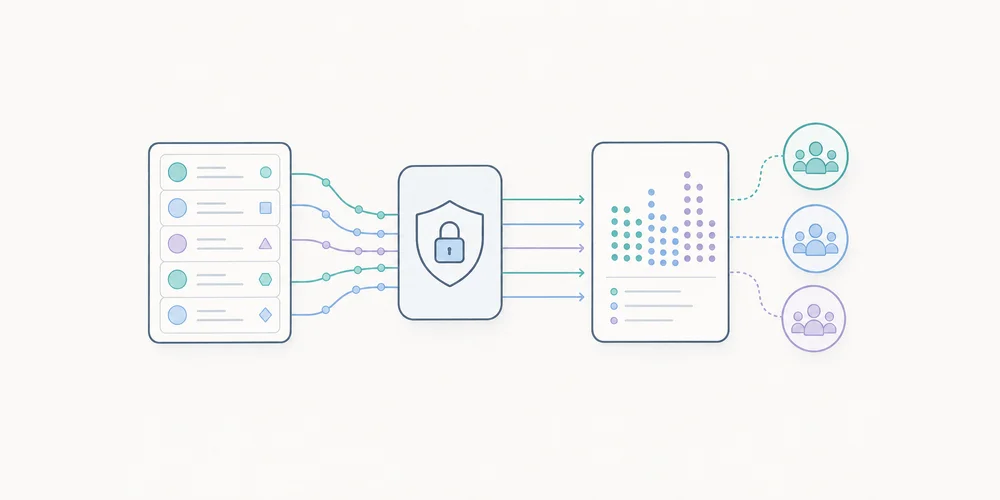
- 21 Sep, 2026
Anonymous, pseudonymised or aggregated data: what the 2026 EDPB guidelines mean for analytics
In analytics products, the words “anonymous”, “anonymised”, “pseudonymised”, “aggregated” and “hashed” are often used too quickly. They create a sense of safety, but they do not always describe the same legal or technical reality. The topic is back in focus in 2026. The European Data Protection Board adopted guidelines on anonymisation, open for public consultation until 30 October 2026. The text aims to clarify the notion of anonymous data and takes recent Court of Justice of the European Union case law into account. For analytics teams, this is a good moment to review both product claims and architecture. Data is not anonymous merely because it no longer contains a name. A truncated IP address, a hashed identifier or an aggregated statistic can reduce risk, but they do not automatically move data outside the scope of personal data. Why this matters for analytics An analytics tool rarely collects a single signal. Even when it is privacy-first, it may process URLs, referrers, campaign parameters, timestamps, countries, devices, events, journeys and rare page views. Each signal may look harmless in isolation. Combined, they may sometimes make a person or behaviour recognisable, especially at low volumes: a page visited by only one person, a very specific segment, a rare conversion, a query containing personal data, or a campaign link with an identifier. The question is not only: “Do we collect direct identifiers?” The question is: could an actor with means reasonably likely to be used still relate the information to a person, and would that person then be identifiable, directly or indirectly? Anonymous, pseudonymised and aggregated are not the same Pseudonymised data replaces or masks some identifiers, but a link with a person can still exist. A hash, stable identifier or separate key can remain personal data if linkage is possible. Aggregated data groups several observations. It often reduces risk, but it does not automatically guarantee anonymity. A statistic on a very small segment can still reveal information about a person or a small group. Anonymous data no longer relates to an identified or identifiable person. That is a demanding threshold. It is not enough to remove visible names. Teams must consider reasonably available means, linkage possibilities and the context of the actor holding or receiving the data. For a blog post, product page or privacy notice, the cautious approach is to reserve “anonymous” for situations that have actually been tested. In other cases, terms such as “minimal collection”, “aggregation”, “no persistent identifier” or “reduced re-identification risk” are often more accurate. Three risks to test Anonymisation methods are usually assessed through three families of risk. 1. Isolation Can a record or unique behaviour be singled out in the dataset? Analytics example: a low-traffic internal page receives a single visit from one country during a precise time window. Even without a name, that observation may be distinctive. 2. Linkage Can several records be linked together or matched with another source? Analytics example: a hashed identifier is used in several exports, or a combination of country, device, referrer and URL makes it possible to follow the same visitor across tables. 3. Inference Can new information be inferred about a person or a small group? Analytics example: a segment such as “visitors to the enterprise pricing page from a specific prospect domain” can reveal commercial intent if volumes are too low. These risks are contextual. They depend on granularity, access to raw data, other available information and the people who can view the reports. What this changes in an analytics setup The first change is vocabulary. Teams should avoid calling data “anonymous” simply because it is cookieless or because no direct identifier is present. Cookieless does not automatically mean anonymous. The second change is architectural. Anonymisation is not assessed only at collection time. It must be considered across the pipeline: collection, preprocessing, storage, aggregation, dashboard display, exports, APIs and deletion. The third change is documentation. If an organisation claims that some data is anonymous, it should be able to explain why. Which columns remain? Which combinations were tested? What thresholds prevent small segments? Who can access raw data? How long is it kept? Example: URLs and campaign parameters URLs are a good example of underestimated risk. A visited page can reveal business context. A URL parameter can contain an email address, CRM identifier, confirmation token, campaign key or customer number. Even in a cookieless tool, storing the full URL without filtering can create accidental collection of personal data. Anonymisation will not necessarily fix the problem if sensitive data is stored in clear form before processing. The better approach is to act upstream:filter or remove risky parameters; retain useful attribution parameters in a controlled way; document filtering rules; avoid unnecessary raw exports; apply display thresholds to low-volume segments.Example: multi-site reporting Multi-site dashboards add another risk. They often consolidate data from several domains, brands, countries or entities. That is useful for governance, but it can also make some behaviours more recognisable when volumes are low. A global manager does not always need every combination of site, page, country, device and hour. A mature dashboard adapts granularity to the role: summary for leadership, operational detail for the team, restricted access to sensitive data. Anonymisation is therefore not only a technical process. It is also a question of access rights and reporting design. Audit checklist To audit analytics claims and architecture, check:is raw data still accessible? are full URLs stored? are risky URL parameters filtered before storage? are stable identifiers used, even if hashed? are small segments hidden or grouped? do exports contain more detail than dashboards? are retention periods justified? are access rights aligned with real need? does marketing use the right vocabulary? can the team explain why a dataset would be considered anonymous?How to use the consultation window The EDPB consultation is open until 30 October 2026. Not every team will submit feedback, but every team can use the deadline as an audit trigger. A useful exercise is to build a data collection summary: data collected, purposes, transformations, granularity levels, retention, access, exports and public wording. The objective is not to prove that everything is anonymous. The objective is to be accurate. A product can be privacy-first without claiming that every dataset is anonymous at every stage. Conclusion The 2026 EDPB guidelines reinforce a simple idea: anonymisation is not a magic word. It is a result to demonstrate in a specific context. For analytics, this clarification is healthy. It pushes teams to collect less, reduce granularity, filter accidental data, control exports and choose more precise wording. Privacy credibility does not come from maximalist vocabulary. It comes from coherent architecture and honest documentation. FAQ Is hashed data anonymous? Not by default. Hashing can be useful, but it does not automatically remove identifiability if the value can be linked back, guessed or combined with other data. Are aggregated analytics reports always anonymous? No. Aggregation reduces risk, but small segments, rare events or unusual combinations can still reveal information about a person or organisation. The relevant question is whether re-identification remains reasonably possible in context. Why does the consultation matter for web analytics? Because analytics vendors and customers often rely on the words anonymous, pseudonymised and aggregated. The EDPB draft gives teams a better checklist for testing those claims. SourcesEDPB - Guidelines 02/2026 on Anonymisation, public consultation EDPB - EDPB sheds light on anonymisation and web scraping for generative AI EDPB - Public consultations

- 14 Sep, 2026
AI Act and analytics: when should an AI feature in a dashboard be disclosed?
Analytics products increasingly include AI-assisted features: automatic monthly traffic summaries, anomaly detection, generated reporting comments, conversational dashboard assistants and optimisation suggestions. Since 2 August 2026, part of the AI Act’s transparency obligations has applied. This is no longer only a topic for public chatbots, large platforms or general-purpose AI models. It can also concern software publishers adding AI interfaces to professional products, depending on the system and use case. The useful question is not: “Does every AI-powered feature need a warning?” The useful question is: is the person directly interacting with an AI system, or being exposed to AI-generated or manipulated content in a context covered by Article 50? This article gives product, marketing, analytics and compliance teams a practical way to reason about the issue. What started to apply on 2 August 2026 The European Commission published guidelines on 20 July 2026 to help providers and deployers comply with transparency obligations for certain AI systems. These obligations started applying on 2 August 2026. They are meant to help people recognise when they are interacting with an AI system or when content has been generated or modified by AI. Broadly speaking, providers must design certain systems so people are informed when they directly interact with AI, and must add machine-readable marks to enable detection of certain AI-generated or manipulated content. Deployers also have information duties in some cases, including deepfakes, certain public-interest content without human review, and some emotion recognition or biometric categorisation systems. For a professional analytics product, not every automated feature falls into the same bucket. A statistical calculation, a rule-based alert or a background anomaly model is not the same as a visible conversational assistant. Case 1: a conversational assistant in the dashboard This is the clearest case. If a user can ask a dashboard assistant a question such as “why did traffic drop this week?”, the user is directly interacting with AI. Where the Article 50 conditions are met and the AI character is not obvious, the interface must inform the user clearly, distinctly and accessibly at the start of the first interaction that they are dealing with an AI system, not a human analyst or a purely deterministic rule. A concise label is usually enough:AI assistant: responses are generated automatically from the data available in this workspace. Verify important conclusions before making decisions.Transparency should not become a frightening legal wall. It should be clear, accessible and proportionate. Case 2: an automatically generated analytics report summary An automatic summary can have several forms. If it remains internal and helps a team prepare its monthly analysis, the main issue is governance: who can generate it, which data it uses, whether it is reviewed, and how the system avoids inventing causes that are not supported by the data. If the summary is sent to clients, a board, investors or the public, the analysis changes. The text may become information generated by an AI system. In some cases, especially where it concerns matters of public interest without human review or editorial control, Article 50 requires specific information. For a B2B analytics vendor, a simple operational rule can help:an internal AI-generated draft should be identified as such in the interface; an automatically generated external report should keep a generation trace; reports that influence important decisions should not be published without real human review; for information published to inform the public on matters of public interest, any human review invoked for the Article 50 exception should be genuine and documented.The key word is genuine. A superficial approval step should not be described as editorial control. Case 3: anomaly detection A system that flags an unusual traffic variation is not always a direct AI interaction. It may be a statistical model, a threshold rule or a background automated process. That does not mean there are no obligations. If personal data is involved, GDPR, minimisation, documentation and governance remain relevant. But Article 50 transparency is not triggered simply because an algorithm exists. The product should name the feature honestly. “Anomaly detected” may be more accurate than “AI discovered a problem”. If an explanation is generated by a model, separate the measured signal from the generated interpretation. Example:Measured signal: organic sessions fell by 34% over seven days. Generated hypothesis: the drop may be related to three acquisition pages. Status: hypothesis to verify, not an automatic conclusion.This distinction reduces analytical hallucination. Case 4: automatic recommendations AI recommendations are attractive: “improve this page”, “reduce this channel”, “increase this budget”. They are also risky if they hide data limitations. In analytics, a recommendation should show:the data used; the period analysed; known exclusions; confidence level or at least uncertainty; the difference between observation, hypothesis and recommendation.The AI Act raises the transparency question for individuals. Analytics credibility adds another one: does the user understand why the recommendation exists? Good design does not only say “AI-generated”. It gives enough context to verify or challenge the recommendation. Provider or deployer: why the distinction matters The Commission distinguishes providers, who develop or place an AI system on the market, from deployers, who use an AI system under their authority in a professional or organisational context. A SaaS publisher integrating an AI feature into its product may be the provider of that feature for its customers. A company enabling that feature for its employees may be a deployer. In some scenarios, both roles coexist. This matters for product teams. It is not enough to assume that the provider of the underlying model carries all responsibility. The software publisher designing the experience, choosing the data, displaying the output and defining the use case should document its own choices. Checklist for an AI feature in analytics Before launching an AI feature, check:does the feature involve direct interaction between the user and an AI system? could the user think they are interacting with a person or a human-authored analysis? can the generated content be exported, shared or published? is real human review planned before external publication? does the interface clearly indicate what is generated automatically? does the output separate measured data, hypotheses and recommendations? are the necessary prompts, model versions and data sources logged, with personal data filtered, controlled access and a defined retention period? are known limits understandable by a business user? can support teams explain the feature at a high level? are related personal-data processing operations documented separately?What to avoid Avoid labels that make AI invisible. “Automatic analysis” may be too vague if the user is actually interacting with a generative system. Avoid the opposite excess too. A heavy legal banner on every chart can make the interface less readable without improving user understanding. Most importantly, avoid unsupported causal claims. A model can detect a correlation or propose a hypothesis, but it should not invent a business cause without evidence. In an analytics dashboard, transparency is not only about legal disclosure. It should help the user make better decisions. Conclusion The AI Act does not mean that every algorithmic feature in an analytics product needs a permanent warning. It does require serious treatment of situations where users directly interact with AI or receive generated content in a context covered by Article 50. For SaaS publishers, the right response is not only legal. It is product discipline: name AI when it is used, explain its limits, log the relevant context, and separate measured facts from generated interpretation. It is also a credibility opportunity. Useful analytics should not merely generate more commentary. It should generate commentary that can be checked. FAQ Are all automated analytics features covered? No. A statistical rule, a trend calculation or a threshold alert is not automatically covered by the AI Act transparency obligations. The first step is to qualify the system and determine whether it directly interacts with a person or generates content that must be disclosed. Do AI summaries need a banner every time? Not necessarily. The information should be clear, understandable and visible at the right point in the workflow. A stable notice attached to the summary module may be more useful than a repeated intrusive alert. Does human review remove all labelling questions? It depends on the context, the use of the report and the actual level of editorial review. The safer approach is to document the validation chain rather than assume that any human review removes every obligation. SourcesEuropean Commission - Guidelines on transparency obligations for providers and deployers of AI systems European Commission - Transparency obligations under Article 50 of the AI Act European Commission - Guidelines published on 20 July 2026
- 07 Sep, 2026
Cyber Resilience Act: preparing incident reporting for software, scripts and SDKs
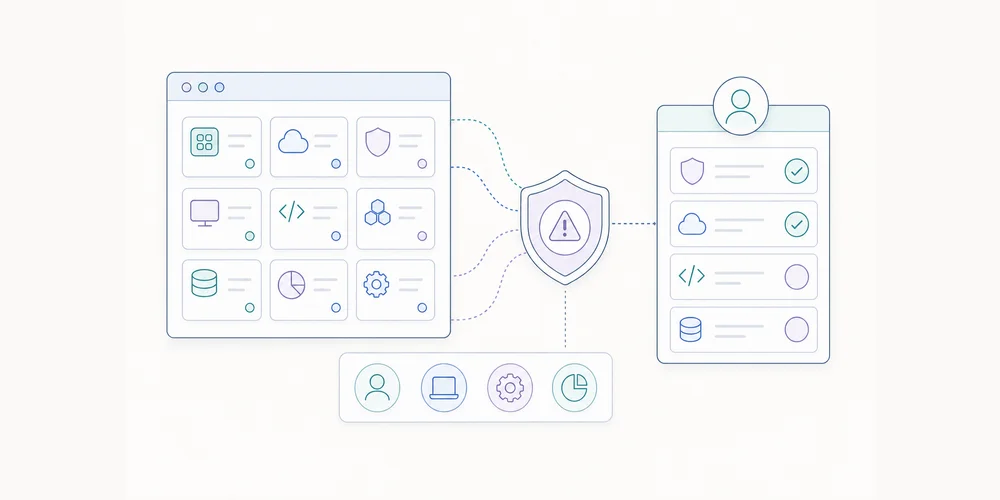
The Cyber Resilience Act is progressively becoming operational for software publishers. From 11 September 2026, manufacturers in scope will have to report actively exploited vulnerabilities and severe incidents that impact the security of products with digital elements. For a B2B SaaS company, analytics tool, JavaScript script, SDK or component distributed to customers, the topic should be analysed carefully. It would be wrong to assume that every SaaS service is automatically covered in the same way. It would also be risky to wait until December 2027 before organising incident response. This article is not a legal qualification. It gives product, security and engineering teams a practical preparation method when they distribute software or components used by customers. What changes on 11 September 2026 The European Commission states that, as of 11 September 2026, manufacturers must report certain events concerning products with digital elements: actively exploited vulnerabilities and severe incidents affecting product security. The timelines are short:early warning without undue delay and within 24 hours of becoming aware; vulnerability notification within 72 hours; final report within the applicable deadline, including 14 days after a corrective measure or mitigation becomes available for an actively exploited vulnerability, or within one month of the 72-hour notification for certain severe incidents.Notifications go through the CRA Single Reporting Platform, operated by ENISA, and are routed to the competent CSIRTs according to the applicable rules. The important point is that these reporting obligations arrive before the full application of the main product obligations under the Cyber Resilience Act. They should be prepared now, even if other parts of the regime come later. Why scripts and SDKs deserve attention Analytics teams often think first about the security of the main application: authentication, dashboard access, exports and databases. But the product surface can include other elements:a JavaScript script installed on customer sites; a client-side or server-side SDK; an open-source library maintained by the vendor; a connector or plugin; an API used to collect or expose data; an admin interface capable of changing injected code.These elements do not automatically have the same legal qualification. But they belong in the security inventory, because a vulnerability in a distributed component can affect multiple customers at once. For an analytics product, the collection script is especially sensitive. It runs on third-party websites, in visitors’ browsers, and may be updated centrally. A distribution flaw, compromised build or unauthorised modification could have a broader impact than a broken chart in a dashboard. Do not confuse a bug, a vulnerability and a severe incident Not every technical issue is a CRA report. A broken chart, a loading problem or an aggregation error is not necessarily an actively exploited vulnerability or a severe security incident. The first step in the runbook should therefore be qualification.Situation Question to askFunctional bug Does it affect product security or only user experience?Internally found flaw Is it exploitable, exposed, fixed or communicated?Actively exploited vulnerability Is there evidence of real exploitation?Security incident Does it have a severe impact on product security or users?Personal-data incident Does it also require separate GDPR breach assessment?The risk runs both ways. Under-reporting a truly serious issue exposes the organisation. Reporting every unqualified bug creates noise and weakens response discipline. The decision should be documented even when the conclusion is that no report is required. The minimal runbook to prepare A useful runbook must be concrete. It should not merely say “notify legal”. It should allow the team to act in the first hours. 1. Component inventory List products, scripts, SDKs, plugins and connectors distributed or made available to customers. For each one, document the internal owner, repositories, build pipeline, update mechanism, exposed customers, critical dependencies and communication channels. 2. Qualification criteria Define a simple grid: whether security is affected, whether exploitation is observed, potential impact, customer scope, corrective measure availability, technical evidence and possible parallel obligations. 3. Decision team Identify who can qualify the event: engineering, security, product, leadership, legal and the DPO when personal data is involved. Backups should be known. Weekends and holidays should be covered. 4. Timestamping The deadline starts when the organisation becomes aware. The team must record when it had enough information to suspect or qualify the event. A ticket without a reliable timestamp will make compliance harder to demonstrate. 5. Evidence and logging Preserve logs, versions, build hashes, deployed artefacts, exploitation traces, customer messages, internal alerts and qualification decisions. The evidence should be sufficient to reconstruct the timeline. 6. Reporting channel The Single Reporting Platform is operated by ENISA. Teams should know who has the necessary access, which information is needed and what to do if the primary access path is unavailable. ENISA has indicated that there is no API planned at this stage, which makes human procedures even more important. 7. Customer communication Regulatory reporting does not replace customer communication. Prepare concise templates: what is known, what remains uncertain, what customers should do and when the next update will come. Analytics and third-party scripts An analytics script should be treated as a sensitive asset, even when it collects limited data. It may be embedded in public pages, conversion funnels or authenticated environments. The security of the script therefore matters not only to the vendor but also to the sites that install it. Concrete controls include:separation of rights between application code, build pipeline and script publication; dependency review; signing or integrity controls for artefacts where relevant; detection of unexpected changes; fast rollback capability; mitigation or disabling procedure; documentation of versions deployed to customers.These practices are useful beyond the CRA. They reduce operational risk and make crisis communication more reliable. What to decide now Teams that wait for the first incident to organise their response will lose time in the first 24 hours. Those are exactly the most constrained hours. By the end of September, a software team should be able to answer four questions:Which customer-distributed components could be in scope? Who qualifies an actively exploited vulnerability? Who can submit a notification within the deadline? How can the decision timeline be proven?If these answers do not exist, the topic is not yet under control. Conclusion The Cyber Resilience Act should not be reduced to a distant 2027 deadline. Reporting obligations applying from 11 September 2026 already require manufacturers in scope to prepare. For SaaS and analytics vendors, the priority is not to panic or to assume everything is automatically covered. The priority is to inventory components, qualify roles, prepare the runbook and document decisions. A good reporting process is not only a regulatory response. It is evidence of product maturity. FAQ Does the CRA apply to every SaaS dashboard? Not automatically. The qualification depends on the product, the role of the organisation and the way software components are placed on the market or provided. The article is a preparation checklist, not a legal classification of every SaaS case. Should every security bug be reported through the CRA process? No. The reporting duty discussed here concerns actively exploited vulnerabilities and severe incidents with a security impact, according to the CRA framework. Ordinary bugs still need internal handling, but they should not be confused with regulatory reporting triggers. Why should analytics teams care? Analytics stacks often include scripts, SDKs, API keys, client-side configuration and third-party dependencies. Even when the legal obligation falls elsewhere, teams need clear incident routing and supplier contacts. SourcesEuropean Commission - Cyber Resilience Act reporting obligations European Commission - Cyber Resilience Act summary ENISA - CRA Single Reporting Platform FAQ

Search Console and generative AI: how to read the new reports without overinterpreting impressions
Google Search Console is becoming more useful for understanding visibility in generative search experiences. In June 2026, Google announced new reports dedicated to how pages appear in generative AI features in Search, such as AI Overviews and AI Mode, as well as some generative AI features in Discover. For SEO teams, this matters. It does not, however, turn Search Console into an attribution tool. An impression in a generative feature does not mean that someone visited your site, read your content, or identified you as the main source. It is a visibility signal. It becomes useful when it is interpreted carefully, compared with actual clicks, and connected to sessions measured on your site. The goal is not to create a new vanity metric. The goal is to understand what this visibility means, what it does not mean, and how to include it in SEO and analytics reporting without blurring the measurement layers. What changed in Search Console On 3 June 2026, Google announced new Search Console performance reports dedicated to generative AI. The reports are designed to help site owners understand how their pages appear in Google Search generative AI features. Google also states that this data remains included in the overall performance reports, while the new view isolates generative visibility. Google rolled the reports out worldwide on 31 August 2026. Their absence should therefore be investigated as an access, configuration or reporting issue rather than treated as the normal initial rollout state. The reports can show:impressions for URLs appearing in generative AI features; the pages involved; countries; devices, where available for Search; dates, with several time granularities; Search Console dates use Pacific Time.These fields are useful, but they do not replace classic Search Console or analytics metrics. They add a layer: visibility inside an interface where the answer is often summarised before a click happens. AI impression, click and session are different signals A frequent mistake is to merge three separate levels of measurement. An AI impression means that one of your URLs appeared in a generative feature according to Google’s reporting methodology. It is a signal of presence in the search interface. A click means that a user selected a link to your site. It is a potential transition from Google to your site. An analytics session means that a visit was observed on your site by your analytics tool, according to its own collection, filtering and deduplication rules. These signals can move differently. A page can gain impressions in AI Overviews without gaining clicks. A page can receive more clicks from Google while analytics sessions do not increase as expected because referrers, redirects, parameters or filters distort the view. Conversely, a drop in sessions does not automatically mean a drop in search visibility. The useful approach is to keep the three levels separate, then reconcile them only when there is a clear diagnostic question. How Google counts AI Mode and AI Overviews Search Console documentation reminds site owners that counting rules vary by feature. For AI Mode, clicks, impressions and position are recorded using the usual Search Console methodology. If a user asks a follow-up question in AI Mode, that follow-up is counted as a new query. For AI Overviews, standard Search Console impression rules apply. The visibility-after-scrolling or expansion rule applies only to the independent widgets for which Google documents it. Links in the same AI Overview may also share the same position in reporting. These details matter. They explain why average position should not be read like a classic organic ranking. Appearing in a generative block is not the same format as a blue link, a carousel, a featured snippet or a local result. What not to conclude too quickly The first trap is to call every generative impression “AI traffic”. Until there is a click, it is not traffic to your site. It is visibility in a search interface. The second trap is to compare generative impressions and classic web impressions as if they belonged to the same inventory. The spaces are different, the displays are different, and user journeys do not create the same click-through behaviour. The third trap is to isolate a single indicator. More impressions can be good if they involve strategic pages. They are less useful if they relate to low-intent queries, irrelevant countries or pages that do not support the business. The fourth trap is to ignore measurement incidents. Search Console has a data anomalies page. It should be checked before attributing a curve break to an SEO or product change. A simple method for reading the report Start with a reference period. Avoid drawing conclusions from one isolated week, especially if the report has just appeared or volumes are low. A four-to-eight-week window is more useful when enough data is available. Then separate pages into three groups:acquisition pages, such as articles, comparisons and guides; conversion pages, such as product, pricing or demo pages; support or brand pages, which often respond to already-qualified queries.For each group, compare generative impressions, Search Console clicks and organic sessions measured on your site. The diagnostic is useful only if you can state a clear hypothesis. Examples:AI impressions increase, but clicks stay flat: your content is visible in the answer, but not necessarily driving site visits; clicks increase, but sessions do not: check referrers, redirects, parameters and analytics filters; impressions drop on a few pages only: check queries, country, device and content changes; all impressions drop suddenly: check Search Console anomalies first, then investigate SEO hypotheses.How to report it monthly In a monthly report for leadership or marketing teams, avoid a single line called “Google AI traffic”. It mixes too many realities. A clearer structure is:Google generative visibility: Search Console impressions in AI features, when available. Google organic traffic: Search Console clicks and analytics sessions. Traffic from external assistants or conversational engines: sessions with identifiable source or referrer, when your analytics tool observes them. Useful actions: demo requests, signups, email clicks, downloads or key events.This separation reduces overinterpretation. It also helps explain why a brand may be displayed more often without necessarily receiving more visits. Useful content actions Generative reports do not rewrite SEO fundamentals. Google states that SEO best practices remain relevant for appearing in generative AI features. Helpful, original, precise and non-commodity content remains more defensible than pages written only to fill a query pattern. In practice, teams can:strengthen pages that answer a real business question; document sources and update dates; clarify definitions, limits and use cases; avoid generic paragraphs that could be replaced by any competitor; connect Search Console to web analytics without merging the metrics.For a privacy-first analytics team, the key is readability. Measuring visibility in AI interfaces is useful only if it supports a decision: improving a page, correcting a diagnostic, adapting a report, or explaining why sessions do not grow at the same pace as impressions. Checklist before making a claim Before announcing a rise or drop linked to generative AI, check:that the report is available for the site; that the period is long enough; that the pages are strategically relevant; that impressions, clicks and sessions are separated; that countries and devices match the target market; that no known data anomaly explains the variation; that analytics attributes organic sessions correctly; that variations are put in context with content changes, seasonality and demand.Conclusion The new Search Console reports for generative AI are useful. They provide a clearer view into a part of Google Search that was previously difficult to isolate. But they should not be treated as automatic proof of traffic, authority or conversion. The right reading is to treat them as a visibility signal, then carefully connect them to clicks and sessions. As search becomes more fragmented, teams need less slogan-driven reporting and more contextual measurement. FAQ Does the Search Console AI report measure visits? No. It primarily reports search performance signals such as impressions and clicks. A visit should be confirmed in analytics when a user actually lands on the site. Does a drop in AI impressions mean SEO visibility declined? Not always. A change may come from real visibility, interface changes or a logging issue. The August 2026 anomaly is a reminder to check official notes before making a claim. Should AI visibility have a separate monthly report? At first, it is usually better to add a dedicated section to the existing SEO report. A separate report only makes sense when the volume and decisions attached to the signal become material. SourcesGoogle Search Central - Introducing Search Generative AI performance reports in Search Console Google Search Central - What are impressions, position, and clicks? Google Search Central - A new resource for optimizing for generative AI in Google Search Google Search Central - Data anomalies in Search Console