Tag: B2b
All blog posts with this tag.
- 20 Jul, 2026
Acquisition pages: seven signals to track without building an analytics maze
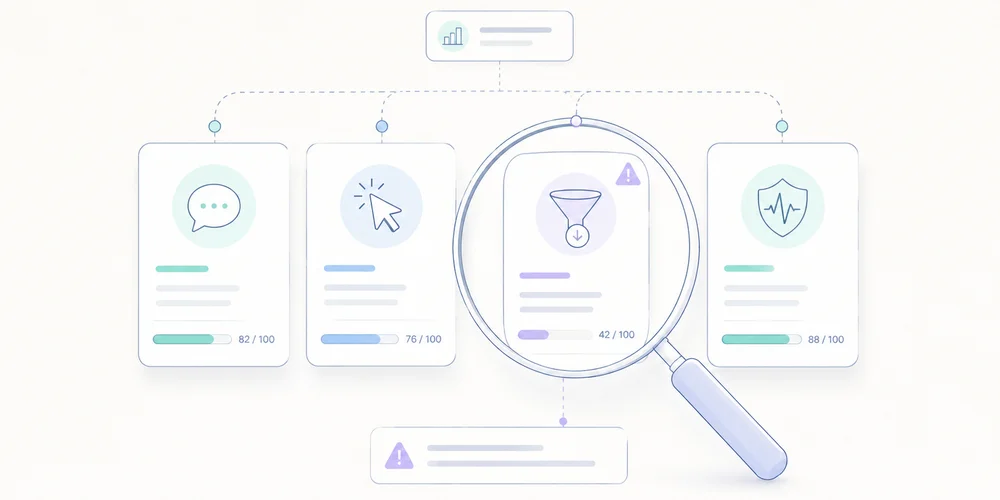
An acquisition page does not need fifty metrics to be managed well. It needs to answer a short chain of questions:are the right people arriving? do they understand the proposition? do they move toward the intended action? do they complete it? are the resulting leads or sales useful? does the page work properly? is the measurement reliable enough to support a decision?This chain prevents two common mistakes. One is judging a page only by traffic volume. The other is adding behavioural events without connecting them to a business decision. For an SME or B2B SaaS team, seven signals are usually enough for a sound diagnosis. Define the page's job before its metrics Not every acquisition page has the same objective. A page may aim to:generate demo requests; start trials; collect quote requests; sell a product; deliver a resource; register attendees; move visitors to pricing; qualify a need before a sales conversation.Its primary KPI follows from that job. An educational content page should not be judged like a demo page. An awareness campaign should not be read like high-intent search. Document four elements first:Element QuestionAudience Who is the page for?Promise Which specific problem does it solve?Source Which channel or campaign brings visitors?Action What useful action should follow the visit?This short brief becomes the reference point when the numbers change. Signal 1: qualified entries by source The first signal is not raw session volume. It is the distribution of entries by source, campaign and intent. Two hundred visits from a precise query may be more useful than two thousand loosely targeted visits. Conversely, low volume does not prove quality if none of the visitors belong to the intended segment. Review at least:visits or sessions starting on the page; source and medium; campaign; identified ad or link content; organic query where Search Console provides it; country or commercial region when genuinely relevant; direct traffic, interpreted cautiously.GA4's Landing page report associates the first pageview in a session with metrics such as sessions and key events. It can also use Session source / medium as a secondary dimension. Search Console complements this view for Google Search with clicks, impressions, CTR, position, queries and pages. The tools do not measure the same thing. Search Console describes visibility and clicks in Google results. Analytics describes activity observed after arrival, within its collection limits. Their totals should not be expected to match visitor by visitor. For campaigns, a stable UTM convention matters more than a sophisticated dashboard. Our guide to UTMs, referrers and direct traffic explains how inconsistent labels fragment reports. Signal 1: Decision question Is the page attracting the audience its message was designed for? Signal 2: intent-to-message fit A page can receive relevant traffic and still fail because its promise does not match the reason behind the click. Compare:the ad copy; the keyword or query; the newsletter link; the visible headline; the supporting proof; the requested action.Someone clicking “compare analytics tools for multiple websites” should encounter that topic immediately. Opening with generic digital-transformation language creates a gap even when the design is polished. No single rate captures this signal. Use several clues:conversion by source or campaign; primary CTA clicks; movement toward the expected section; very fast exits, interpreted cautiously; feedback from sales or support; focused user tests.Engagement time can flag an anomaly, but it is not proof of interest. A long duration may mean close reading or confusion. A short duration may mean abandonment or an immediate answer. Signal 2: Decision question Does the visitor clearly find the promise that brought them to the page? Signal 3: primary call-to-action activity The primary CTA is the first observable commitment toward the objective. Track an action that matters, such as:clicking Request a demo; opening a form; moving to pricing; adding to cart; starting a trial; confirming a download; scheduling a meeting.Do not label every click as a conversion. Accordion opens, tab clicks and scroll depth can support diagnosis, but they do not carry the same intent as a commercial action. A useful measurement sequence is usually:page entry; primary CTA click; form or flow start; successful completion.This separates a messaging weakness from a form problem. If few visitors click, investigate what happens before the CTA. If many click but few finish, inspect the next step. A minimal analytics tracking plan helps keep those definitions stable. Signal 3: Decision question Does a sufficient share of qualified visitors choose to continue? Signal 4: conversion completion The final conversion is the action the business considers useful. It must be unambiguous. Examples include:an accepted form submission; a confirmed appointment; an account creation; a completed payment; an activated trial; a delivered download.Always name the denominator. “Eight per cent conversion” is meaningless without knowing whether it refers to visitors, sessions, form opens or CTA clicks. For a form, measure at least:opens; starts; errors; abandonment; successful completion.Do not send field values to analytics. Form content may contain names, email addresses, phone numbers, free text and other personal data. The business system needs the content. Analytics usually only needs a technical or functional status. Signal 4: Decision question Where does the journey lose people who already expressed intent? Signal 5: post-conversion quality A page can achieve a strong conversion rate and create poor commercial outcomes. For B2B teams, the decisive signal often appears after the form:fit with the target profile; a request genuinely related to the product; an attended meeting; an opportunity created; continued sales progression; revenue or value created; spam and off-target demand.Connect acquisition to the CRM with proportionate granularity. You do not always need to send personal CRM data back into analytics. An aggregate table by campaign, source or landing page may be enough to answer which entries produce useful demand. Agree on a short sales classification:qualified; unqualified; duplicate; spam; outside market; no next step; opportunity.This prevents marketing from optimizing only for form volume. Signal 5: Decision question Does the page create useful outcomes rather than submissions alone? Signal 6: technical performance and errors A slow or unstable page can damage the experience before the message is evaluated. Core Web Vitals provide three field indicators:LCP for main-content loading; INP for interaction responsiveness; CLS for visual stability.Complement them with operational checks:JavaScript errors; forms that cannot submit; blocked resources; mobile CTAs hidden by layout; incorrect redirects; a 404 after submission; missing or duplicated tracking; consent logic applied incorrectly; abnormal server response time.Do not confuse correlation with causation. A technical improvement may accompany a conversion increase without being its only cause. Use performance data to identify differences by device, release and period. Signal 6: Decision question Is a technical constraint preventing part of the audience from progressing? Signal 7: measurement health The seventh signal concerns the data itself. Before interpreting a change, verify:event volume relative to visits; duplicated tags; consent changes; missing or inconsistent campaign parameters; redirects that lose parameters; sensitive values in URLs; form changes; releases during the period; time-zone differences; internal filters and exclusions.A 30 per cent increase may come from a successful campaign, a duplicated event or a changed definition. Document measurement changes before assigning a business cause. Our guide to privacy-first URL parameter filtering helps prevent identifiers and sensitive values from entering reports. Signal 7: Decision question Does the observed change describe the market, or a change in the measurement system? A minimal dashboard A landing-page dashboard can use this structure:Block Primary measure Useful breakdownAudience Qualified entries Source, campaign, deviceMessage CTA clicks / entries Source, variantJourney Starts and completions Step, deviceOutcome Useful conversions Campaign, segmentQuality Qualified leads Source, pageTechnical Vitals and errors Device, releaseMeasurement Documented anomalies Date, deploymentLimit comparisons to segments that can lead to action. A filter that changes no decision adds complexity without improving control. Review cadence Weekly Check:traffic breaks; form errors; misattributed campaigns; extreme changes; mobile problems; performance incidents.Monthly Review:source quality; conversion trends; lead quality; pages and campaigns to improve; tested hypotheses; decisions made.Put the conclusion into the monthly web report rather than sending a separate export from each tool. Metrics not to over-interpret Bounce rate Its definition varies by tool and context. A short visit to a page that answers a question immediately is not necessarily a failure. Scroll depth It may show how far content was traversed, but not what was understood. It is useful for comparing variants, not for proving intent. Time on page It combines attention, confusion, abandoned tabs and measurement constraints. Heatmaps They can help form a hypothesis, but they do not replace conversion data or user research. They also involve more detailed collection that should be assessed separately. Click volume It only matters when the action matches an explicit objective and the event is not emitted more than once. Conclusion An acquisition page should be managed as a chain, not as a ranking of metrics. The seven useful signals are:qualified entries; intent-to-message fit; CTA activity; conversion completion; post-conversion quality; technical performance; measurement health.Start with this structure. Add a metric only when it answers a question the team is prepared to act on. FAQ What is the primary KPI for a landing page? It is the useful action defined for that page: a qualified request, trial, purchase, meeting or another explicit result. Traffic and engagement mostly explain that result. Should scroll depth be measured? Only when it tests a specific hypothesis, such as whether an important proof point is rarely reached. Scroll should not be treated as a conversion. Why do GA4 and Search Console show different figures? They measure different stages and scopes. Search Console measures appearances and clicks in Google Search. GA4 measures sessions or events observed on the site, according to its setup and consent choices. How can a landing page be connected to revenue? Preserve source, campaign and landing-page context in the CRM or a controlled attribution table, then analyse aggregate cohorts. Avoid sending unnecessary personal CRM data back to analytics. How many events should be tracked? For most B2B pages, four levels are enough: entry, CTA click, journey start and success. Add diagnostic events only when they address a known problem. Sources Sources checked on June 21, 2026.Google Analytics, Landing page report Google Search Console, Performance report web.dev, Web Vitals Google Analytics, collect campaign data with custom URLs CNIL, cookies and other trackers