Category: Analytics
All blog posts in this category.
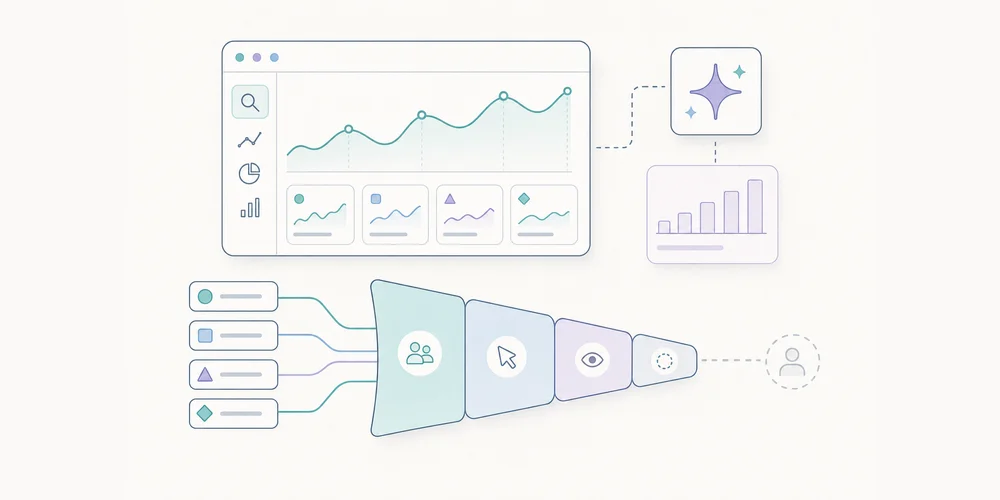
Search Console and generative AI: how to read the new reports without overinterpreting impressions
Google Search Console is becoming more useful for understanding visibility in generative search experiences. In June 2026, Google announced new reports dedicated to how pages appear in generative AI features in Search, such as AI Overviews and AI Mode, as well as some generative AI features in Discover. For SEO teams, this matters. It does not, however, turn Search Console into an attribution tool. An impression in a generative feature does not mean that someone visited your site, read your content, or identified you as the main source. It is a visibility signal. It becomes useful when it is interpreted carefully, compared with actual clicks, and connected to sessions measured on your site. The goal is not to create a new vanity metric. The goal is to understand what this visibility means, what it does not mean, and how to include it in SEO and analytics reporting without blurring the measurement layers. What changed in Search Console On 3 June 2026, Google announced new Search Console performance reports dedicated to generative AI. The reports are designed to help site owners understand how their pages appear in Google Search generative AI features. Google also states that this data remains included in the overall performance reports, while the new view isolates generative visibility. Google rolled the reports out worldwide on 31 August 2026. Their absence should therefore be investigated as an access, configuration or reporting issue rather than treated as the normal initial rollout state. The reports can show:impressions for URLs appearing in generative AI features; the pages involved; countries; devices, where available for Search; dates, with several time granularities; Search Console dates use Pacific Time.These fields are useful, but they do not replace classic Search Console or analytics metrics. They add a layer: visibility inside an interface where the answer is often summarised before a click happens. AI impression, click and session are different signals A frequent mistake is to merge three separate levels of measurement. An AI impression means that one of your URLs appeared in a generative feature according to Google’s reporting methodology. It is a signal of presence in the search interface. A click means that a user selected a link to your site. It is a potential transition from Google to your site. An analytics session means that a visit was observed on your site by your analytics tool, according to its own collection, filtering and deduplication rules. These signals can move differently. A page can gain impressions in AI Overviews without gaining clicks. A page can receive more clicks from Google while analytics sessions do not increase as expected because referrers, redirects, parameters or filters distort the view. Conversely, a drop in sessions does not automatically mean a drop in search visibility. The useful approach is to keep the three levels separate, then reconcile them only when there is a clear diagnostic question. How Google counts AI Mode and AI Overviews Search Console documentation reminds site owners that counting rules vary by feature. For AI Mode, clicks, impressions and position are recorded using the usual Search Console methodology. If a user asks a follow-up question in AI Mode, that follow-up is counted as a new query. For AI Overviews, standard Search Console impression rules apply. The visibility-after-scrolling or expansion rule applies only to the independent widgets for which Google documents it. Links in the same AI Overview may also share the same position in reporting. These details matter. They explain why average position should not be read like a classic organic ranking. Appearing in a generative block is not the same format as a blue link, a carousel, a featured snippet or a local result. What not to conclude too quickly The first trap is to call every generative impression “AI traffic”. Until there is a click, it is not traffic to your site. It is visibility in a search interface. The second trap is to compare generative impressions and classic web impressions as if they belonged to the same inventory. The spaces are different, the displays are different, and user journeys do not create the same click-through behaviour. The third trap is to isolate a single indicator. More impressions can be good if they involve strategic pages. They are less useful if they relate to low-intent queries, irrelevant countries or pages that do not support the business. The fourth trap is to ignore measurement incidents. Search Console has a data anomalies page. It should be checked before attributing a curve break to an SEO or product change. A simple method for reading the report Start with a reference period. Avoid drawing conclusions from one isolated week, especially if the report has just appeared or volumes are low. A four-to-eight-week window is more useful when enough data is available. Then separate pages into three groups:acquisition pages, such as articles, comparisons and guides; conversion pages, such as product, pricing or demo pages; support or brand pages, which often respond to already-qualified queries.For each group, compare generative impressions, Search Console clicks and organic sessions measured on your site. The diagnostic is useful only if you can state a clear hypothesis. Examples:AI impressions increase, but clicks stay flat: your content is visible in the answer, but not necessarily driving site visits; clicks increase, but sessions do not: check referrers, redirects, parameters and analytics filters; impressions drop on a few pages only: check queries, country, device and content changes; all impressions drop suddenly: check Search Console anomalies first, then investigate SEO hypotheses.How to report it monthly In a monthly report for leadership or marketing teams, avoid a single line called “Google AI traffic”. It mixes too many realities. A clearer structure is:Google generative visibility: Search Console impressions in AI features, when available. Google organic traffic: Search Console clicks and analytics sessions. Traffic from external assistants or conversational engines: sessions with identifiable source or referrer, when your analytics tool observes them. Useful actions: demo requests, signups, email clicks, downloads or key events.This separation reduces overinterpretation. It also helps explain why a brand may be displayed more often without necessarily receiving more visits. Useful content actions Generative reports do not rewrite SEO fundamentals. Google states that SEO best practices remain relevant for appearing in generative AI features. Helpful, original, precise and non-commodity content remains more defensible than pages written only to fill a query pattern. In practice, teams can:strengthen pages that answer a real business question; document sources and update dates; clarify definitions, limits and use cases; avoid generic paragraphs that could be replaced by any competitor; connect Search Console to web analytics without merging the metrics.For a privacy-first analytics team, the key is readability. Measuring visibility in AI interfaces is useful only if it supports a decision: improving a page, correcting a diagnostic, adapting a report, or explaining why sessions do not grow at the same pace as impressions. Checklist before making a claim Before announcing a rise or drop linked to generative AI, check:that the report is available for the site; that the period is long enough; that the pages are strategically relevant; that impressions, clicks and sessions are separated; that countries and devices match the target market; that no known data anomaly explains the variation; that analytics attributes organic sessions correctly; that variations are put in context with content changes, seasonality and demand.Conclusion The new Search Console reports for generative AI are useful. They provide a clearer view into a part of Google Search that was previously difficult to isolate. But they should not be treated as automatic proof of traffic, authority or conversion. The right reading is to treat them as a visibility signal, then carefully connect them to clicks and sessions. As search becomes more fragmented, teams need less slogan-driven reporting and more contextual measurement. FAQ Does the Search Console AI report measure visits? No. It primarily reports search performance signals such as impressions and clicks. A visit should be confirmed in analytics when a user actually lands on the site. Does a drop in AI impressions mean SEO visibility declined? Not always. A change may come from real visibility, interface changes or a logging issue. The August 2026 anomaly is a reminder to check official notes before making a claim. Should AI visibility have a separate monthly report? At first, it is usually better to add a dedicated section to the existing SEO report. A separate report only makes sense when the volume and decisions attached to the signal become material. SourcesGoogle Search Central - Introducing Search Generative AI performance reports in Search Console Google Search Central - What are impressions, position, and clicks? Google Search Central - A new resource for optimizing for generative AI in Google Search Google Search Central - Data anomalies in Search Console
- 27 Jul, 2026
Analytics migration: a checklist for changing tools without rebuilding tracking debt
Changing analytics tools can look simple: replace a script, wait a few days and compare the charts. That is rarely enough. A migration changes several layers at once:collected data; metric definitions; consent behaviour; events and conversions; website and workspace structure; access; retention; reports; decision-making habits.The main risk is not losing a chart. It is carrying old tracking debt into a new tool, then reading a methodological change as a business change. This checklist offers a twelve-step migration process for SMEs, B2B SaaS companies and multi-site teams. 1. Define why the migration is happening Write down the reason for the change. Examples include:reducing collection complexity; documenting data more clearly; improving readability across teams; reducing cost; controlling hosting or retention; simplifying consent governance; managing several sites consistently; replacing a discontinued or unsuitable tool.Turn the reason into acceptance criteria.Objective Verifiable criterionSimplify The monthly report uses five stable indicatorsReduce collection Every collected field has a documented purposeGovern multiple sites Access and naming are consistentControl cost Total cost is known for expected volumeClarify consent The actual configuration is documented and testedImprove quality Critical events pass an acceptance testWithout criteria, the project ends when the script runs. With criteria, it ends when the team can make decisions confidently again. Use the analytics governance scorecard to formalise this stage. 2. Inventory the current system before removing anything Create a technical and editorial inventory. Scripts and collection points List:scripts loaded by the site; tag-manager tags; advertising pixels; server-side collection; CMS plugins; mobile SDKs; backend events; CRM, support, payment and email integrations; consent settings; proxies and collection domains.Data and reports List:pageviews; events; conversions; custom dimensions; audiences; segments; funnels; recurring reports; exports; alerts; dashboards; API consumers; report recipients.Responsibilities For each component, record:owner; purpose; destination; collection condition to review; retention; access; dependencies; decision: keep, transform or remove.This inventory becomes the basis of the analytics data collection summary. It often reveals tags that nobody uses. 3. Freeze definitions before rebuilding Two tools may use the same words for different metrics. Visitor, user, session, engagement, bounce, conversion and source can depend on:time windows; identification methods; session rules; filters; consent; bot processing; time zones; attribution; received events.Create a migration dictionary:Business concept Previous definition New definition DecisionVisit Current session rule New tool's rule Compare trendsLead Form event Accepted submission StandardiseSource Calculated channel Referrer/UTM Document gapConversion Historical list Priority goals ReduceInternal traffic IP filter New rule RetestDo not force false equivalence. A documented break in the series is safer than artificially aligned numbers. 4. Reduce the tracking plan A migration is an opportunity to remove, not only copy. Classify existing events into four groups:decision events, required for a KPI or action; diagnostic events, useful for explaining a problem; operational events, required by an integration; orphan events, collected without an identifiable use.Remove orphans. Consolidate variants that describe the same action. Choose stable names and a clear property set. A critical event should specify:name; trigger; page or context; permitted parameters; example; owner; related KPI; success test.A minimal analytics tracking plan provides a practical baseline. 5. Inspect collection and URLs Before installing the new tool, review what it will actually receive. URLs can contain:UTM parameters; campaign IDs; internal search terms; email addresses; tokens; order references; customer IDs; form values; technical fragments.Define an allowlist or removal strategy. Keep acquisition parameters where necessary, but remove sensitive or purely technical values before storage. The guide to privacy-first URL parameter filtering explains this control. Also inspect:referrer; IP handling; headers; user agent; event properties; server-side payloads; infrastructure logs; exports.Cookieless describes only one part of collection. The migration must document the full signal set. 6. Review consent, contracts and governance Changing tools does not automatically make a configuration exempt from consent. Review:purposes; trackers or terminal access; collected data; enrichment; third-party disclosure; provider reuse; transfers outside the EEA; subprocessors; retention; objection mechanisms where relevant; user information; consent-manager configuration.The CNIL describes strict conditions for limited audience-measurement configurations. It also states that a solution should not be presented as officially certified or approved by the authority. Update:the processing register; privacy notice; tracker inventory; data-processing agreement; access and deletion procedures; internal documentation.The assessment follows the real configuration, not the provider name alone. 7. Build a pilot environment Avoid replacing every site at once. Choose:a representative site; one acquisition page; one form; a few critical events; enough traffic to observe behaviour; a period without a major redesign.Install the new tool as a pilot. A short, controlled parallel-measurement period may be useful, but two active systems can mean two scripts, two collections and two consent configurations. The goal is not identical totals. It is to verify that:expected pages appear; events fire once; sources are readable; filters work; conversions correspond to real success; time zones and domains are correct; access is controlled; sensitive data is absent.8. Use an acceptance-test plan A compact matrix is enough.Test Expected result Evidence StatusPageview One occurrence Network debug To validateSuccessful form One event after success Test ID To validateForm error No conversion Test evidence To validateUTM Readable source/campaign Test URL To validateSensitive parameter Value absent Received request To validateConsent declined Behaviour matches configuration CMP test To validateInternal traffic Excluded or identified Controlled session To validateCross-domain Coherent journey Controlled session To validateMobile CTA and form work Device tests To validateTest:normal and private browsing; mobile and desktop; accepted and declined consent; ad blockers where relevant; redirects; subdomains; languages; successful and failed forms; test campaigns.Store evidence with date, version and owner. 9. Decide what to do with history Historical data does not always need to be imported into the new tool. There are three options. Keep the previous tool read-only This is often simplest where contract, security and cost allow it. Restrict access and set a deletion date. Export an aggregate history Keep the indicators needed for future comparison:monthly traffic; top pages; sources; conversions; objectives; campaign notes; measurement incidents.A documented file or controlled warehouse may be sufficient. Import into the new tool Some providers offer imports. Plausible, for example, documents a Google Analytics import. GA4 can export event data to BigQuery when the link has been configured. An import does not guarantee a perfectly comparable series. Verify:imported scope; missing dimensions; granularity; definitions; time period; duplicates; time zones; consent-related restrictions; storage cost; deletion policy.Do not retain everything merely because it exists. Apply the analytics data retention policy to migrated history. 10. Prepare cutover and rollback The cutover should be reversible. Write a runbook containing:date and time; affected sites; technical owner; business owner; scripts to enable; scripts to disable; CMP configuration; immediate checks; alert thresholds; rollback procedure; communication channel; final approval.Avoid cutover:immediately before a major launch; on Friday evening; during a major campaign; without people available to fix issues; at the same time as a redesign and CRM change.Monitor critical events daily during the first week. 11. Rebuild reports around decisions Do not reproduce every dashboard automatically. Start with:objectives; five KPIs; priority pages; sources; conversions; lead quality; incidents; actions.For multiple properties, use shared naming and separate local reporting from consolidated management. The multi-site analytics dashboard guide provides a structure. Update the monthly web report with a migration note:migration date; previous and new tools; changed definitions; non-comparable metrics; stabilisation period; known anomalies.This note protects later analysis. 12. Decommission the old tool properly The migration is not complete while the previous system remains active without a purpose. Confirm that:scripts are removed from code; tags are removed from the manager; server collection is stopped; API keys are revoked; users and access are removed; webhooks are disabled; scheduled exports are stopped; collection domains are removed; contracts are adjusted; data is deleted or archived according to policy; the register and privacy notice are updated; billing is stopped; documentation is closed.Inspect network traffic after removal. An old tag may survive in a template, plugin, unpublished container or forgotten subdomain. Differences you should accept Differences during migration are normal. They can result from:session rules; consent; blockers; bot filtering; time zones; processing delays; duplicated events in the old system; user definitions; attribution; excluded pages; server-side collection.Assess differences by scenario rather than obsessing over totals. For a critical page or conversion, verify that the trend and operational result make sense. Document structural differences and establish a new baseline after stabilisation. Final checklist Before closing the project, confirm that: objectives and acceptance criteria are written; the old system is inventoried; definitions are documented; unnecessary events are removed; URLs and parameters are filtered; consent and contracts are reviewed; the pilot is validated; critical tests are documented; the history strategy is decided; cutover has a rollback path; reports are rebuilt; the old tool is decommissioned; a new baseline is communicated.Conclusion A good analytics migration does not copy every screen. It preserves useful decisions, clarifies definitions and removes collection that no longer has a purpose. The safest sequence is:inventory; define; reduce; document; pilot; test; cut over; decommission.The expected outcome is not merely a new dashboard. It is a measurement system that is easier to understand and govern. FAQ How long should two tools run in parallel? Only long enough to validate critical scenarios and observe normal operation. The right period depends on traffic and conversion cycles. A long overlap increases complexity, cost and collection. Should the new tool show identical figures? No. Definitions, filters, consent and session rules may differ. Compare scenarios, trends and real conversions rather than demanding artificial equality. Should all historical data be imported? Not necessarily. Keep only what supports obligations, comparisons or future decisions. A documented aggregate history is often more useful than a full but poorly comparable import. How can UTM parameters be preserved? Test redirects, forms and domain changes with controlled campaign URLs. Verify that useful parameters are read before they are removed or normalised. When should the old tool be deleted? After the new setup is validated, necessary history is secured, reports are updated and no integration still depends on the previous system. Sources Sources checked on June 21, 2026.CNIL, audience measurement solutions CNIL, defining data retention periods Google Analytics, set up BigQuery Export Google Analytics, account and property structure Plausible, import stats from Google Analytics OWASP, information exposure through query strings

- 20 Jul, 2026
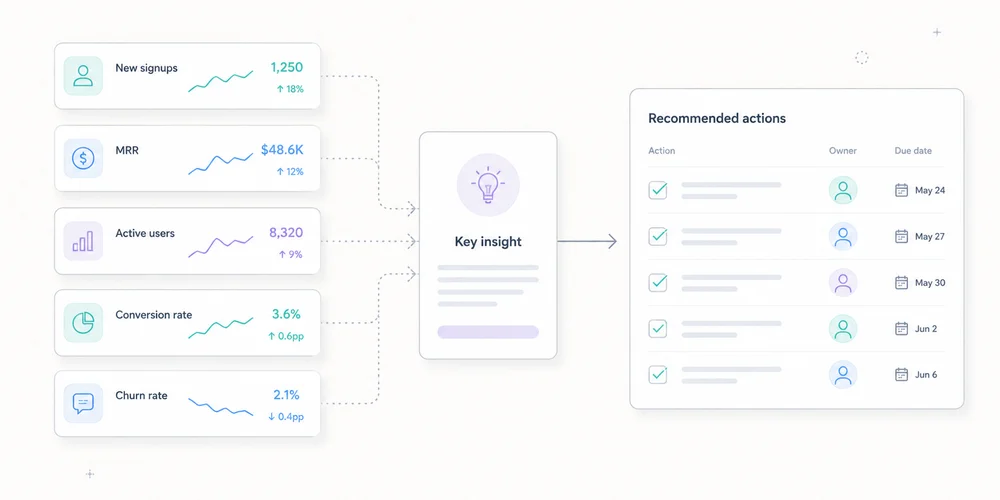
Acquisition pages: seven signals to track without building an analytics maze
An acquisition page does not need fifty metrics to be managed well. It needs to answer a short chain of questions:are the right people arriving? do they understand the proposition? do they move toward the intended action? do they complete it? are the resulting leads or sales useful? does the page work properly? is the measurement reliable enough to support a decision?This chain prevents two common mistakes. One is judging a page only by traffic volume. The other is adding behavioural events without connecting them to a business decision. For an SME or B2B SaaS team, seven signals are usually enough for a sound diagnosis. Define the page's job before its metrics Not every acquisition page has the same objective. A page may aim to:generate demo requests; start trials; collect quote requests; sell a product; deliver a resource; register attendees; move visitors to pricing; qualify a need before a sales conversation.Its primary KPI follows from that job. An educational content page should not be judged like a demo page. An awareness campaign should not be read like high-intent search. Document four elements first:Element QuestionAudience Who is the page for?Promise Which specific problem does it solve?Source Which channel or campaign brings visitors?Action What useful action should follow the visit?This short brief becomes the reference point when the numbers change. Signal 1: qualified entries by source The first signal is not raw session volume. It is the distribution of entries by source, campaign and intent. Two hundred visits from a precise query may be more useful than two thousand loosely targeted visits. Conversely, low volume does not prove quality if none of the visitors belong to the intended segment. Review at least:visits or sessions starting on the page; source and medium; campaign; identified ad or link content; organic query where Search Console provides it; country or commercial region when genuinely relevant; direct traffic, interpreted cautiously.GA4's Landing page report associates the first pageview in a session with metrics such as sessions and key events. It can also use Session source / medium as a secondary dimension. Search Console complements this view for Google Search with clicks, impressions, CTR, position, queries and pages. The tools do not measure the same thing. Search Console describes visibility and clicks in Google results. Analytics describes activity observed after arrival, within its collection limits. Their totals should not be expected to match visitor by visitor. For campaigns, a stable UTM convention matters more than a sophisticated dashboard. Our guide to UTMs, referrers and direct traffic explains how inconsistent labels fragment reports. Signal 1: Decision question Is the page attracting the audience its message was designed for? Signal 2: intent-to-message fit A page can receive relevant traffic and still fail because its promise does not match the reason behind the click. Compare:the ad copy; the keyword or query; the newsletter link; the visible headline; the supporting proof; the requested action.Someone clicking “compare analytics tools for multiple websites” should encounter that topic immediately. Opening with generic digital-transformation language creates a gap even when the design is polished. No single rate captures this signal. Use several clues:conversion by source or campaign; primary CTA clicks; movement toward the expected section; very fast exits, interpreted cautiously; feedback from sales or support; focused user tests.Engagement time can flag an anomaly, but it is not proof of interest. A long duration may mean close reading or confusion. A short duration may mean abandonment or an immediate answer. Signal 2: Decision question Does the visitor clearly find the promise that brought them to the page? Signal 3: primary call-to-action activity The primary CTA is the first observable commitment toward the objective. Track an action that matters, such as:clicking Request a demo; opening a form; moving to pricing; adding to cart; starting a trial; confirming a download; scheduling a meeting.Do not label every click as a conversion. Accordion opens, tab clicks and scroll depth can support diagnosis, but they do not carry the same intent as a commercial action. A useful measurement sequence is usually:page entry; primary CTA click; form or flow start; successful completion.This separates a messaging weakness from a form problem. If few visitors click, investigate what happens before the CTA. If many click but few finish, inspect the next step. A minimal analytics tracking plan helps keep those definitions stable. Signal 3: Decision question Does a sufficient share of qualified visitors choose to continue? Signal 4: conversion completion The final conversion is the action the business considers useful. It must be unambiguous. Examples include:an accepted form submission; a confirmed appointment; an account creation; a completed payment; an activated trial; a delivered download.Always name the denominator. “Eight per cent conversion” is meaningless without knowing whether it refers to visitors, sessions, form opens or CTA clicks. For a form, measure at least:opens; starts; errors; abandonment; successful completion.Do not send field values to analytics. Form content may contain names, email addresses, phone numbers, free text and other personal data. The business system needs the content. Analytics usually only needs a technical or functional status. Signal 4: Decision question Where does the journey lose people who already expressed intent? Signal 5: post-conversion quality A page can achieve a strong conversion rate and create poor commercial outcomes. For B2B teams, the decisive signal often appears after the form:fit with the target profile; a request genuinely related to the product; an attended meeting; an opportunity created; continued sales progression; revenue or value created; spam and off-target demand.Connect acquisition to the CRM with proportionate granularity. You do not always need to send personal CRM data back into analytics. An aggregate table by campaign, source or landing page may be enough to answer which entries produce useful demand. Agree on a short sales classification:qualified; unqualified; duplicate; spam; outside market; no next step; opportunity.This prevents marketing from optimizing only for form volume. Signal 5: Decision question Does the page create useful outcomes rather than submissions alone? Signal 6: technical performance and errors A slow or unstable page can damage the experience before the message is evaluated. Core Web Vitals provide three field indicators:LCP for main-content loading; INP for interaction responsiveness; CLS for visual stability.Complement them with operational checks:JavaScript errors; forms that cannot submit; blocked resources; mobile CTAs hidden by layout; incorrect redirects; a 404 after submission; missing or duplicated tracking; consent logic applied incorrectly; abnormal server response time.Do not confuse correlation with causation. A technical improvement may accompany a conversion increase without being its only cause. Use performance data to identify differences by device, release and period. Signal 6: Decision question Is a technical constraint preventing part of the audience from progressing? Signal 7: measurement health The seventh signal concerns the data itself. Before interpreting a change, verify:event volume relative to visits; duplicated tags; consent changes; missing or inconsistent campaign parameters; redirects that lose parameters; sensitive values in URLs; form changes; releases during the period; time-zone differences; internal filters and exclusions.A 30 per cent increase may come from a successful campaign, a duplicated event or a changed definition. Document measurement changes before assigning a business cause. Our guide to privacy-first URL parameter filtering helps prevent identifiers and sensitive values from entering reports. Signal 7: Decision question Does the observed change describe the market, or a change in the measurement system? A minimal dashboard A landing-page dashboard can use this structure:Block Primary measure Useful breakdownAudience Qualified entries Source, campaign, deviceMessage CTA clicks / entries Source, variantJourney Starts and completions Step, deviceOutcome Useful conversions Campaign, segmentQuality Qualified leads Source, pageTechnical Vitals and errors Device, releaseMeasurement Documented anomalies Date, deploymentLimit comparisons to segments that can lead to action. A filter that changes no decision adds complexity without improving control. Review cadence Weekly Check:traffic breaks; form errors; misattributed campaigns; extreme changes; mobile problems; performance incidents.Monthly Review:source quality; conversion trends; lead quality; pages and campaigns to improve; tested hypotheses; decisions made.Put the conclusion into the monthly web report rather than sending a separate export from each tool. Metrics not to over-interpret Bounce rate Its definition varies by tool and context. A short visit to a page that answers a question immediately is not necessarily a failure. Scroll depth It may show how far content was traversed, but not what was understood. It is useful for comparing variants, not for proving intent. Time on page It combines attention, confusion, abandoned tabs and measurement constraints. Heatmaps They can help form a hypothesis, but they do not replace conversion data or user research. They also involve more detailed collection that should be assessed separately. Click volume It only matters when the action matches an explicit objective and the event is not emitted more than once. Conclusion An acquisition page should be managed as a chain, not as a ranking of metrics. The seven useful signals are:qualified entries; intent-to-message fit; CTA activity; conversion completion; post-conversion quality; technical performance; measurement health.Start with this structure. Add a metric only when it answers a question the team is prepared to act on. FAQ What is the primary KPI for a landing page? It is the useful action defined for that page: a qualified request, trial, purchase, meeting or another explicit result. Traffic and engagement mostly explain that result. Should scroll depth be measured? Only when it tests a specific hypothesis, such as whether an important proof point is rarely reached. Scroll should not be treated as a conversion. Why do GA4 and Search Console show different figures? They measure different stages and scopes. Search Console measures appearances and clicks in Google Search. GA4 measures sessions or events observed on the site, according to its setup and consent choices. How can a landing page be connected to revenue? Preserve source, campaign and landing-page context in the CRM or a controlled attribution table, then analyse aggregate cohorts. Avoid sending unnecessary personal CRM data back to analytics. How many events should be tracked? For most B2B pages, four levels are enough: entry, CTA click, journey start and success. Add diagnostic events only when they address a known problem. Sources Sources checked on June 21, 2026.Google Analytics, Landing page report Google Search Console, Performance report web.dev, Web Vitals Google Analytics, collect campaign data with custom URLs CNIL, cookies and other trackers
- 13 Jul, 2026
Monthly web reporting: build a report leadership will actually read
A web report can contain forty pages and produce no decision. Leadership rarely lacks charts. It lacks clear answers to five questions:What changed? Does it matter? Why do we think it changed? What action follows? Can we trust the data?Monthly reporting should be a decision document, not an archive of every available metric. A strong version has one main page, with appendices for investigation. It uses no more than five coherent indicators, contextualised changes and assigned actions. What monthly reporting is for A dashboard answers questions on demand. A monthly report establishes a shared reading at a point in time. It supports goals, detects gaps, explains known changes, records hypotheses, signals measurement limits and coordinates marketing, product, sales and engineering. It should not prove that the analytics team worked. Data volume is not decision quality. Start with the reader Leadership needs trend, target gap, business impact, risk, decision, owner and deadline. Operational teams need channel, page, campaign, event, segment, anomaly and methodology detail. Create two layers:decision summary; diagnostic appendices.The first must make sense without opening a dashboard. A seven-block format 1. One summary sentence Lead with the message, not total traffic. Example:Demo requests increased 18% on stable traffic, mainly through two organic landing pages. Lead quality still needs confirmation through the sales cycle.It contains result, comparison, likely mechanism and limitation. Avoid:The site recorded 42,847 sessions.Without a goal or comparison, the number says little. 2. Three to five KPIsMetric Month Change Target StatusQualified visits 18,240 +4% 18,000 MetDemo requests 126 +18% 120 MetVisit-to-demo rate 0.69% +0.08 pp 0.65% MetSales-accepted leads 61 +7% 70 BelowCollection incidents 2 +2 0 FixStatus follows a defined rule, not decorative colour. For B2B SaaS, the chain might be qualified audience, web conversion, sales quality, acquisition efficiency and measurement health. For content sites, use relevant organic entrances, useful engagement, product transition, signup and technical coverage. A portfolio can use the multi-site governance view as a common baseline with local metrics. 3. Significant changes Do not comment on every row. Select three to five movements above normal noise. Examples:conversions up 22% from one landing page; paid search down after budget reduction; direct traffic up on an untagged email campaign; Search Console impressions changed after a measurement or visibility shift; six hours of missing events; mobile improvement after a performance release.For each, record: Observation Magnitude Scope Hypothesis Evidence ConfidenceThis prevents correlation from becoming certainty. 4. Explanations and confidence Classify explanations:confirmed: documented deployment, budget change or outage; probable: several signals agree; possible: hypothesis to test; unknown: insufficient data.Example:Organic conversions probably increased because two pages gained both Search Console clicks and analytics entrances. Confidence: medium. Sales quality will be available after lead review.Confidence language is more honest than invented causality. 5. Decisions and actionsAction Owner Deadline Success measureApply the proof block to two product pages Content 25 July +10% conversion on tested pagesFix newsletter tagging Growth 15 July Direct share returns to normal on landing pageAudit event loss Engineering 10 July No collection gaps for 30 daysAn action without an owner is an intention. One without success criteria is a task without learning. 6. Data quality Add a visible box: Overall confidence: medium to high Known coverage: public site, excluding customer app Incidents: 6-hour loss on 12 June Changes: new CMP on 18 June Method break: qualified-lead definition changed 1 June Missing data: last 5 days of sales qualificationDo not hide quality in a footnote. Credibility improves when the report says what it does not know. 7. Appendices Appendices can cover sources, landing pages, campaigns, events, Search Console, web performance, segments, methodology, definition history and dashboard links. They support diagnosis, not the main reading. Choose five indicators Connect every KPI to a decision Ask what changes if the metric rises or falls. A metric with no possible action is probably descriptive. Define numerator and denominator A conversion rate can mean conversions per session, visitor, landing-page entry or started form. Write the formula and flag definition changes. Separate volume, efficiency and qualityvolume: demo requests; efficiency: conversion rate; quality: sales-accepted requests.Higher volume with lower quality is not automatically better. Add a reliability metric Examples include valid-event share, time without data, properties in error, consent coverage, unattributed traffic and CRM qualification delay. Measurement has its own performance. Compare the right periods Use previous month for operations, prior year for seasonality when comparable, target for relevance, and moving averages for low-volume trends. Two comparisons are usually enough: June 2026 vs May 2026 June 2026 vs monthly targetNormalise days, working days, time zone, currency, conversion definition, site scope, consent, campaigns and incidents. Use Search Console and analytics together Search Console and analytics observe different objects. Search Console reports Google search clicks and impressions under its rules. Analytics records visits or events collected on the site. Differences can result from incomplete page loads, consent, blocking, time zones, URL grouping, filters, bots and session definitions. Use triangulation:Search Console for visibility, queries and clicks; analytics for landing pages and on-site actions; CRM for quality and revenue.Do not force equality. Add web performance without overload Current Core Web Vitals cover:LCP for loading; INP for responsiveness; CLS for visual stability.Leadership reporting can show the share meeting expectations, trend, critical pages, release impact and action. Use field data where available for real-user experience, with laboratory tests for diagnosis. A one-page example Web performance, June 2026 Summary Demo requests increased 18% on stable traffic. Two organic pages explain most of the growth. Sales-accepted leads remain below target, limiting the conclusion on quality. KPIsKPI Result vs May TargetQualified visits 18,240 +4% 18,000Demos 126 +18% 120Conversion rate 0.69% +0.08 pp 0.65%Accepted leads 61 +7% 70Collection availability 99.2% -0.8 pp 100%Three facts/analytics-guide/ generated 21 demos versus 10 in May. Paid search fell 14% after budget reduction. Direct rose on an email landing page, probably because links lacked UTM tags.DecisionsApply the guide-page pattern to two product pages. Fix the newsletter link generator. Review lead qualification with sales.Data quality A six-hour collection incident affected 12 June. The latest five days of CRM qualification are incomplete. The page can be read in two minutes. Appendices answer follow-up questions. Automate preparation, not judgement Automate extraction, variation calculations, tables, freshness controls, alerts, definition snapshots and draft generation. Keep human review for selecting important facts, validating anomalies, stating hypotheses, assigning confidence and deciding actions. Automation does not know why a campaign stopped, a form changed or a lead category has different value. A monthly calendar Day 1: data checks Verify freshness, incidents, definitions and imports. Day 2: analysis Identify movements, triangulate and prepare hypotheses. Day 3: operational review Marketing, product and sales confirm known changes. Day 4: publication Send the summary with actions. Mid-month: follow-up Check decisions before the next report. The exact schedule can be faster. Keep control, analysis and validation separate. Mistakes that make reporting useless Showing everything An exhaustive report prioritises nothing. Commenting only on growth Growth can remain below target or come from low-quality channels. Hiding incidents They will surface later and undermine the whole report. Claiming attribution without evidence “The campaign caused the increase” needs more than timing. Changing KPIs every month Continuity disappears. Change metrics when strategy changes and record the transition. Reporting team activity rather than outcomes “Ten articles published” is activity. Qualified entries and conversions from content are outcomes, still requiring cautious interpretation. Conclusion A useful monthly report has seven blocks:summary; KPIs; changes; explanations and confidence; actions; data quality; appendices.It keeps leadership informed without hiding complexity. It makes uncertainty visible, connects numbers to targets and assigns every conclusion to an action. Five well-defined indicators reviewed consistently beat fifty ownerless charts. FAQ How long should a monthly report be? The main summary can fit on one page. Appendices may be longer but should remain optional for leadership. PDF or dashboard link? Use a dated summary with access to detail. A short email or document plus dashboard link often works better than an exhaustive export. How many KPIs? Three to five primary KPIs are usually enough. Keep diagnostics in appendices. How should uncertain data be presented? State the limitation, possible cause and confidence. Do not replace missing data with a confident story. Previous month or previous year? Use previous month for operations and previous year for seasonality when scopes are comparable. Target variance is often the most useful comparison. SourcesGoogle Analytics, Reports overview Google Search Console, Performance report web.dev, Web Vitals Google Analytics, Landing page report Google Analytics, Traffic-source dimensions
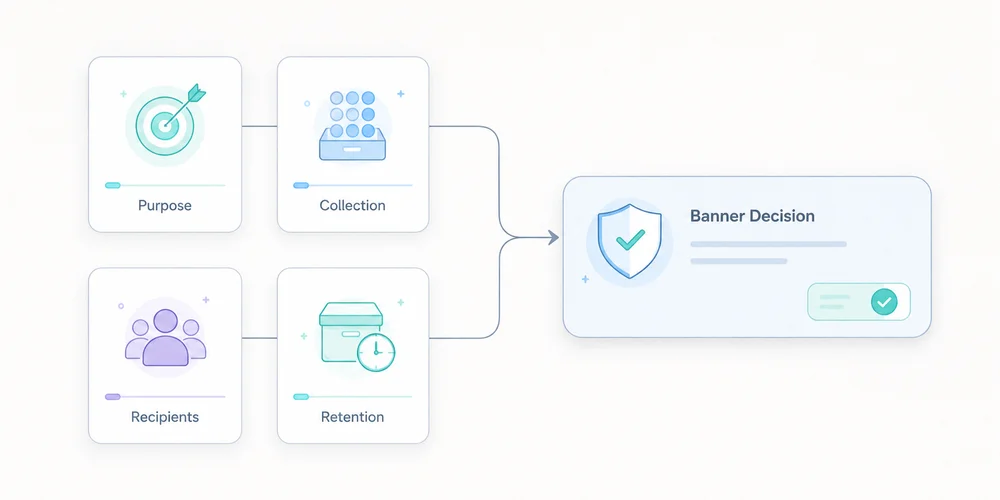
Analytics consent: what to verify before promising “no cookie banner”
“Cookieless analytics” is often shortened to “consent-free analytics” and then to “no cookie banner”. Those statements are not equivalent. A tool can avoid HTTP cookies while reading or writing information on a device through another mechanism. A product may offer a limited audience-measurement configuration while other modules require a different assessment. And even when analytics fits a strict framework, videos, support widgets, advertising pixels or embedded forms elsewhere on the site may still require consent. The right question is not, “Is the tool cookieless?” It is:Which trackers and processing operations are actually deployed on this site, in this configuration, for which purposes and under which conditions?This is an assessment framework, not legal advice. It must be adapted to the countries, uses and setup involved. Do not confuse three layers 1. Storage or access technology A cookie is one technique. The ePrivacy framework more broadly addresses storing information on a user's terminal or accessing information already stored there, as transposed in national law. Local storage, SDKs, pixels, fingerprinting mechanisms and other terminal access can therefore raise consent questions without a traditional HTTP cookie. Cookieless is a technical characteristic, not a complete legal classification. 2. The ePrivacy tracker regime In France, Article 82 of the Data Protection Act implements the tracker rules. The general principle is prior information and consent for covered operations, with exceptions including operations strictly necessary for a service expressly requested. The CNIL also describes conditions under which certain audience-measurement trackers may fall within an exemption. This is a narrow framework, not a general exemption for all analytics. 3. Personal-data processing under the GDPR Even when a terminal operation does not require ePrivacy consent in a particular configuration, GDPR duties can still apply if personal data are processed. Purposes, legal basis, transparency, minimisation, retention, recipients, transfers, security and rights may still need to be documented. No banner does not mean no processing or no information. The French limited audience-measurement conditions The CNIL states that, to remain strictly necessary for the service and potentially fall within the described exemption, trackers must in particular:be strictly limited to measuring the audience of the site or app; operate exclusively on behalf of the publisher; produce anonymous statistics only; avoid combining the data with other processing; avoid transmitting non-anonymous data to third parties; avoid global tracking across websites or apps.The CNIL also recommends informing users, limiting tracker lifetime, for example to thirteen months without automatic extension, retaining collected information for no more than twenty-five months, and reviewing those periods. Each condition matters. Strictly limited purpose Technical performance, viewed content and navigation problems may fit the described logic. Advertising audiences, CRM enrichment, ad personalisation and cross-service tracking do not share the same purpose. One product interface may offer both. Audit the enabled feature, not only the vendor name. Exclusively for the publisher The provider should not turn the collection into data for its own targeting, profiling or incompatible cross-client measurement. Review the contract, product documentation and subprocessors. A marketing statement is not enough. Anonymous statistics “Anonymous” is a demanding word. Removing a name, truncating an IP address or hashing an identifier does not automatically create anonymity. If a signal still distinguishes or connects a person, use cautious terminology. Ask the vendor to explain transformations and re-identification risk. No global cross-site tracking A shared identifier used to deduplicate people across properties changes the scope. This matters for groups and agencies consolidating audiences. A multi-site dashboard can aggregate indicators without requiring a cross-site person identifier. The checklist before any no-banner promise 1. Inventory the whole site Do not begin and end with analytics. Include:analytics; tag managers; embedded video and maps; support chat; forms; fraud prevention; experimentation; session replay; advertising; social widgets; security and CDN tooling; partner scripts; mobile SDKs where relevant.Run a tracker audit before and after each consent choice, across several pages and journeys. Strict analytics does not neutralise an advertising pixel elsewhere. 2. State real purposes For every component, state what it enables:aggregate audience statistics; campaign analysis; personalisation; advertising; security; interaction recording; support; product experimentation.“Improve the service” is too broad to govern a configuration. 3. Identify terminal operations Document cookies, local storage, session storage, cache identifiers, SDKs, pixels, device characteristics, consent signals and withdrawal. A scanner showing no cookies does not close the assessment. 4. Inspect collected data and transformations The data collection summary should answer:Is the IP address received, used and stored? Is the full URL transmitted? Is the user-agent raw or reduced? Is a visitor identifier created? Is it stable across days or sites? Are UTM parameters retained? Can free-form events contain text? Which data are aggregated? At what point can a record no longer single someone out?An “anonymous mode” that nobody can explain is not evidence. 5. Review vendor use Ask whether the vendor:acts only as a processor for this collection; reuses data for its own purposes; combines data between customers; produces benchmarks from individual-level data; trains another product; sends data to subprocessors; makes international transfers.Benchmarking can sometimes be designed on separated aggregate data. It still needs to be understood. 6. Verify the exact configuration Documentation may say “can be configured to meet the criteria”. That does not mean your default account does. Keep evidence of:configuration export or screenshots; script version; collection parameters; disabled modules; allowed domains; retention; sharing options; verification date; owner.The CNIL tells publishers to request documentation and operating instructions from providers. 7. Review retention Separate tracker or identifier lifetime, raw events, statistics, technical logs, backups and exports. Test automated deletion. A dashboard retention setting may not cover files exported by your team. 8. Inform visitors Even when consent is not required for a strictly framed measurement setup, the CNIL recommends informing users, for example in the privacy notice. Depending on context, explain purpose, relevant data, general operation, duration, provider, recipients, rights, contact and relevant transfers. “We use privacy-friendly analytics” is not enough. 9. Test refusal and withdrawal Where part of the stack relies on consent:covered trackers must not start before the choice; refusal must follow applicable interface requirements; withdrawal must have an effect; the signal must reach all relevant tags; new pages and components must respect the choice.Test behaviour, not only the CMP appearance. 10. Validate and retain the assessment The controller makes the final decision, with DPO or legal support where appropriate. Record:countries; purposes; inventory; criteria reviewed; vendor evidence; configuration; tests; residual risks; date and owners; review triggers.The answer may differ for a French corporate site, an authenticated app and an international property group. Cookieless, consent mode and no banner Cookieless The term can mean no persistent cookie, no cookie in one mode, alternative storage, identifier-free events, server-derived identifiers or simply no advertising cookie. Ask for the technical definition. Consent mode A consent mode communicates user choices to tags and can change their behaviour. Depending on the product and setup, signals may still be sent without advertising cookies. It helps implement a decision. It does not decide whether no-consent collection is legally permitted, and it does not turn advertising into strictly necessary measurement. No banner This statement can only be assessed across the complete site. It may be reasonable when no non-essential component runs before consent and the audience measurement genuinely meets the applicable framework. It is misleading when based only on the absence of an analytics cookie. Claims to avoidabsolute GDPR or legal-compliance claims; blanket consent-exemption claims; claims that cookie-free analytics automatically remove every banner; claims of official CNIL certification; claims of official CNIL approval; “No personal data” “No legal assessment required”The CNIL explicitly states that a solution cannot present itself as certified or approved by the authority merely because of the audience-measurement self-assessment. More accurate wording includes:“cookieless by default”; “designed for minimal collection”; “can be configured for limited audience measurement”; “exemption depends on purposes, configuration and context”; “users remain informed”; “the complete site stack must be audited”.Precision protects credibility as well as compliance. When a banner remains necessary Depending on applicable law and configuration, consent is generally still relevant for:personalised advertising; retargeting; ad-network sharing; cross-site tracking; profile enrichment; some session-replay uses; non-essential personalisation; third-party embeds with non-essential trackers; analytics beyond a limited measurement purpose.The existing guide to session replay and the CNIL consultation explains why detailed behavioural recording should not be treated like aggregate audience statistics. A simple decision process Case A: strictly limited measurement Minimal collection, no cross-site tracking, no vendor reuse, anonymous statistics, controlled retention, information and documentation. Action: assess and document the local framework, then inspect the rest of the site. Case B: enriched analytics after consent The team wants detailed events, advanced attribution or more persistent identifiers. Action: block the relevant capabilities until consent, transmit the choice correctly and document the processing. Case C: mixed stack Minimal measurement runs by default, with extended modules enabled after consent. Action: separate the modes technically, prevent reporting changes from silently expanding collection, and test every transition. Clear separation is more credible than one setting claimed to fit every use. Conclusion A no-banner promise cannot be inferred from “cookieless”. It follows from an assessment of the complete site, purposes, terminal operations and configuration. Before communicating, verify:every component; purposes; terminal access; data and identifiers; vendor use; configuration; retention; transparency; consent behaviour where applicable; the documented decision.The result may be a no-banner strict stack, a consent-based extended stack, or a clearly separated combination. Quality comes from the distinction, not the slogan. FAQ Is cookieless analytics automatically exempt from consent? No. Assess other terminal operations, purposes, data, identifiers and applicable national law. Cookieless is a technical feature, not a legal conclusion. Does the CNIL certify exempt analytics tools? No. The CNIL provides criteria and a self-assessment tool but says providers cannot present that self-assessment as official certification or approval. Can visitors be informed without a banner? Yes, when consent is not required for the relevant collection, information can be provided in a privacy notice or another appropriate location. It must remain clear and accurate. Do UTM tags prevent an exemption? Not automatically, but their use and combination must remain compatible with the limited purpose, minimisation and absence of cross-site tracking. They must never contain personal data. Who decides whether the site can operate without a banner? The controller makes and documents the decision, supported by a DPO or legal adviser where needed. A vendor alone cannot guarantee the answer for every site. SourcesCNIL, Audience-measurement cookies and consent conditions CNIL, What does the law say about cookies and trackers? Directive 2002/58/EC on privacy and electronic communications EDPB, Guidelines 05/2020 on consent EDPB, Guidelines 2/2023 on the technical scope of Article 5(3) ePrivacy
- 08 Jun, 2026
Multi-site analytics dashboard: manage 5, 10 or 30 websites without losing clarity
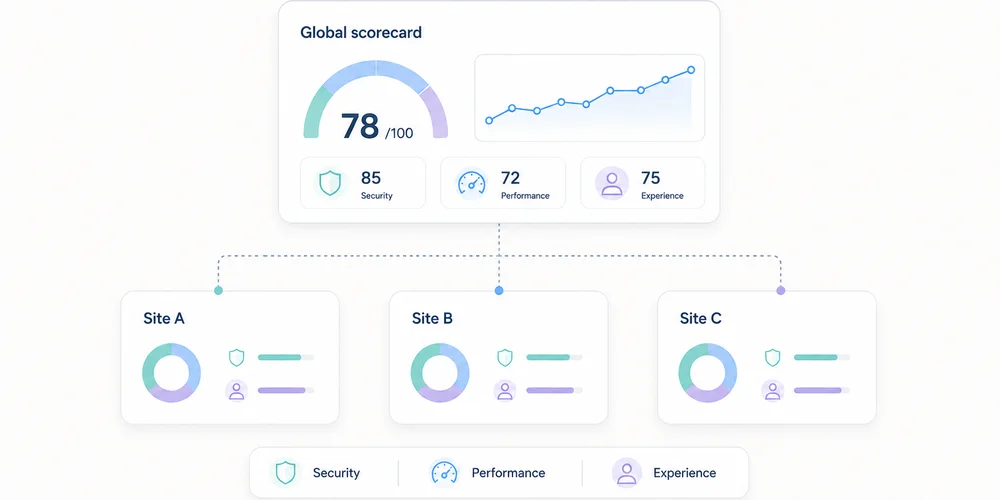
Tracking one website is a measurement problem. Tracking ten becomes a governance problem. Each team initially creates its own analytics property, event names and dashboard. Months later, the group has ten definitions of “conversion”, three time zones, incompatible campaign taxonomies and accounts with unclear ownership. The missing piece is not another chart. It is a shared structure. A useful multi-site dashboard must support two movements:compare properties on a consistent baseline; drill into each site without erasing its business context.Combining everything creates an abstract average. Separating everything hides the portfolio. The right architecture preserves both levels. Start with a property map List every site and its role before choosing metrics.Property Role Main audience Meaningful conversion OwnerCorporate site Trust Prospects, partners Qualified contact CommunicationsProduct A Acquisition SMBs Demo request Growth AProduct B Acquisition Mid-market Meeting booked Growth BHelp centre Support Customers Self-service resolution SupportBlog Discovery B2B audience Signup or product visit ContentSites with different purposes should not be ranked only by traffic. A help centre can perform well by reducing support demand even when it generates no demos. The map should also record:domains and subdomains; production environment; analytics tool and property ID; time zone; currency where relevant; creation date; business owner; technical owner; access list; collection mode; retention; active, migrating or archived status.This becomes the reference inventory. Define a common measurement contract The multi-site baseline is not a dashboard. It is a compact measurement contract applied to every property. Common dimensions Use shared definitions for:page or path; referrer domain; source, medium and campaign; country or region; device class; date and time zone; primary events; conversion status.Apply one URL parameter policy and one UTM taxonomy. Common events A small library is enough: form_submitted demo_requested signup_completed download_completed outbound_clicked search_usedEvery event needs a definition, trigger, allowed properties, owner, test and version. One name must not represent different actions. Conversely, three names for the same contact request prevent comparison. Common quality rules Document:test-environment filtering; bot handling; internal-domain handling; consent and collection modes; path normalisation; time zone; deployment process; alert thresholds.The data collection summary can hold the shared baseline and property-specific exceptions. Separate three reading levels A sound multi-site system does not put every chart on one page. Level 1: portfolio view This answers management questions:Which sites gain or lose useful traffic? Where are conversions moving? Which property has an anomaly? Which team needs investigation? Which site stopped sending data?Keep it short. A table with one row per property is often more useful than twenty small charts.Site Visits Change Useful conversions Rate Main channel Data statusCorporate 24,500 +6% 132 0.54% Organic OKProduct A 18,100 -4% 284 1.57% Paid search ReviewProduct B 9,600 +12% 96 1.00% Partners OKHelp 41,000 +2% n/a n/a Direct OKFigures are illustrative. Data status matters: a fall means something different when collection broke. Level 2: property view Each site retains its business dashboard:acquisition; landing pages; content; conversions; events; trends; data quality.A SaaS property may track trials, while a help centre tracks unsuccessful searches or support escalation. Level 3: diagnostics Analysts and engineers need:events by version; collection errors; unknown parameters; client/server discrepancies; time-series breaks; unexpected domains; test traffic; ingestion delay.Keep diagnostics out of executive reporting, but do not omit them. Otherwise every anomaly becomes a manual investigation. KPIs that can be compared Visits and page views They show scale but naturally favour larger sites. Always include trend and context. Common meaningful conversions A shared conversion group can include demo requests, qualified contacts, verified signups or confirmed purchases. Preserve the conversion mix too. A total can hide a shift toward lower-value actions. Conversion rate Rates compare different property sizes only when the denominator is identical. Document whether it uses visits, visitors, sessions or landing-page entries. Channel share Organic, paid, email, partner, referral and direct shares reveal dependence. This requires one campaign taxonomy. Collection health Add technical KPIs:time of last received event; event-volume change; rejected-event share; unknown parameters; pages missing path or title; abrupt direct-traffic movement.Data reliability is a governance KPI. What not to add naively Unique visitors The same person can visit several domains. Adding each site's unique visitors counts them more than once. A global identifier for deduplication materially changes collection. The CNIL notes that using the same identifier across several sites for global tracking falls outside the French consent-exemption conditions it describes for certain audience-measurement trackers. A lightweight report can instead use:visits by property; a clearly labelled non-deduplicated reach sum; or an aggregate method that does not require a person-level cross-site identifier.Heterogeneous conversions A brochure download is not automatically equal to a sale. Show a common total and its composition. Simple averages An average of ten conversion rates gives equal weight to a site with 100 visits and one with 100,000. Use a weighted overall rate or show the distribution. Unaligned periods Time zones and campaign calendars can move events between days or weeks. Normalise time before comparison. Compare without punishing small sites Multi-site views easily become rankings. That is rarely helpful. Use four axes:current level; change over time; local target; measurement confidence.A niche site can have low volume, healthy growth and high-value outcomes. A large site can hide paid-channel dependence or broken tracking. Trends and comparison bands are more useful than a podium. Structure access Multi-site operations increase excess-access risk. Define roles:portfolio owner: sees all properties and manages standards; site owner: administers one property; analyst: views and exports as needed; contributor: sees reports without changing collection; agency or partner: access limited to contracted properties; technical support: temporary, logged access when required.Avoid shared accounts. Review access quarterly, remove access at contract end and apply least privilege. Establish a governance cycle Weekly: monitor health Automate simple alerts for no data, abnormal shifts, unknown domains, rejected events and sudden direct-traffic changes. Monthly: discuss decisions Ask property owners:What changed? What action follows? Which hypothesis will be tested?Reporting should not become a reading of numbers. Quarterly: review the contract Check common events, UTM naming, inactive properties, access, retention, vendors, configuration differences and business goals. At launch: use a checklist Before adding a site:assign owners; set time zone; apply the collection baseline; configure filters; test events; verify consent behaviour; add it to the portfolio; document exceptions; create alerts; schedule the first review.Choose an architecture One property per site This is usually clearest for access, retention and configuration. It requires a portfolio layer for comparison. One shared property with a site dimension It can simplify some reports but mixes permissions, configurations and collection risks. One mistake affects the full dataset. One property per site plus a consolidated view This is often the best compromise: operational separation with portfolio aggregation. Some vendors provide roll-up or consolidated views. Verify plan requirements, deduplication method, permissions and exactly which data are combined. The key factor is not only the number of sites. It is their independence across teams, brands, purposes, regions, access and privacy settings. A one-page dashboard model Top stripportfolio visits; useful conversions; weighted overall rate; healthy property count; open anomaly count.Central table One row per property with trend, conversion, channel and status. Acquisition block Channel shares by site. Content block Top landing pages and rising pages, filterable by property. Quality block Missing data, rejected events, access reviews and recent deployments. Each block links to a detailed view. The portfolio dashboard signals; it does not explain everything. Conclusion Multi-site measurement works when governance comes before visualisation. You need:a clear property map; a common measurement contract; documented exceptions; three reading levels; comparable indicators; restricted access; a review cycle; consolidation that does not force person-level cross-site tracking.The best dashboard does not make every site identical. It gives them a shared language while preserving their role. FAQ Should every website have its own analytics property? It is often the clearest way to separate access and configuration. A consolidated view can compare them. A shared property can work when purposes and permissions are genuinely shared. Can unique visitors be added across sites? Not as deduplicated reach. One person can appear in several properties. Label the number as non-deduplicated or use an appropriate aggregate approach without introducing a global identifier by default. How many KPIs belong in the portfolio view? Five to eight well-defined columns are usually enough: volume, trend, conversion, rate, main channel and collection health. Details belong in property views. How should different site goals be handled? Keep a small common baseline and add local indicators. Compare each site with its own target and trend, not only with other sites. How often should access be reviewed? Quarterly review is a reasonable practice, with immediate removal when employees or vendors leave. SourcesCNIL, Audience-measurement cookies and consent conditions Google Analytics, Analytics account structure Google Analytics, Roll-up properties Matomo, Roll-Up Reporting Plausible, Consolidated view Regulation (EU) 2016/679, purpose limitation and data minimisation principles
- 01 Jun, 2026
Which URL parameters should privacy-first analytics filter?
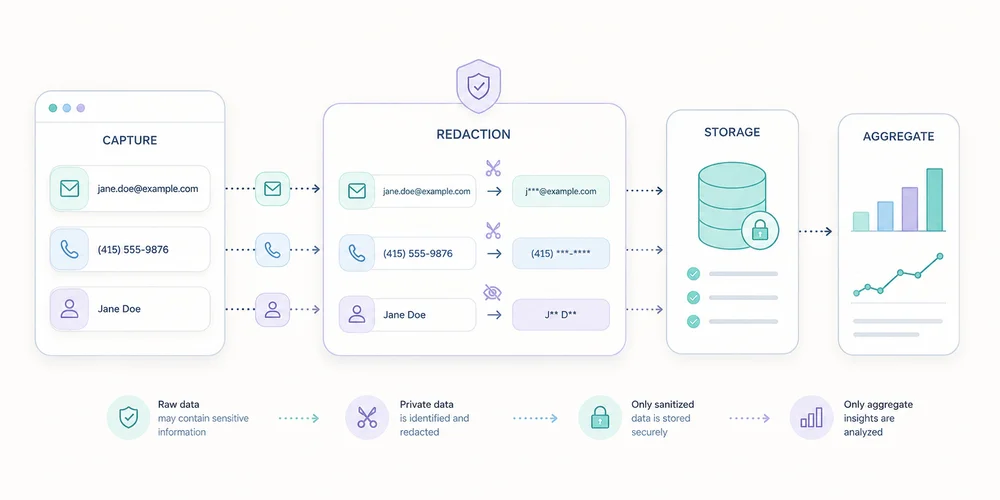
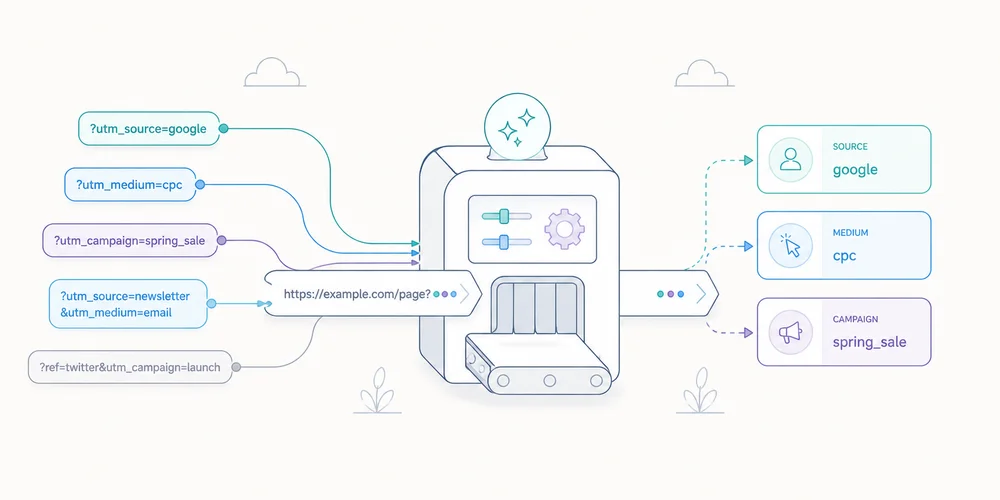
A URL can look harmless while carrying far more information than the page path. https://example.com/confirmation? email=alice@example.com& order_id=84721& utm_source=newsletter& session_token=abc123If analytics collects the full URL, those values may appear in events, logs, exports, screenshots and shared reports. The problem often starts before the analytics platform: the application placed excessive information in the address. A privacy-first approach applies two controls:do not put personal or sensitive information in URLs; send analytics only the parameters that have an explicit purpose.Filtering is not a single patch. It is defence in depth. Why query parameters need their own policy The part after ? is the query string. It contains key-value pairs separated by &. Parameters can be used to:attribute a campaign; paginate or sort a list; select language; prefill a form; identify a resource; carry a token; manage an experiment; preserve a search filter.Browsers, servers, CDNs, monitoring systems and third-party scripts can all observe parts of a URL. OWASP notes that sensitive values in query strings can appear in browser history, logs, intermediary systems and sometimes referrer data, even over HTTPS. HTTPS protects transport between endpoints. It does not hide the URL from authorised systems that process it. Prefer an allowlist to an endless blocklist A blocklist names forbidden parameters: email phone token user_idIt fails when somebody introduces customer_email, invitee, auth or another unknown key. An allowlist names the few parameters justified for analytics: utm_source utm_medium utm_campaign utm_contentEverything else is removed before transmission or storage. This is usually more robust for minimal collection. It also reduces report fragmentation: /products/?sort=price, /products/?sort=name and /products/?session=xyz can map to one stable path when those variants do not answer a business question. Some applications genuinely need functional parameters. The method is not “delete everything after ?” but classify each family. A six-category decision framework 1. Approved campaign parameters Examples: utm_source utm_medium utm_campaign utm_contentThey can help read acquisition when naming is controlled and person-level identifiers are forbidden. The guide to UTM tags, referrers and direct traffic explains the taxonomy. Possible decision:collect a short list; normalise case and values; keep campaign dimensions separate from page path; remove visible parameters after capture when that does not break the journey.2. Functional parameters with no analytics value Examples: sort view page theme currencyThey may be required by the interface without belonging in the page report. Keeping them can generate hundreds of rows. Possible decision:exclude them from the analytics page URL; emit a dedicated event only when a product decision depends on the behaviour; keep a reduced category such as filter_applied, not the free-form value.3. Potentially useful content parameters Examples: lang category plan variantBefore approval, ask:Does the value change a decision? Is there a closed set of valid values? Can it contain free text or an identifier?When the answers are safe, transform it into a controlled dimension. Otherwise remove it. 4. Business identifiers Examples: order_id invoice customer ticket workspaceThey can connect a visit to a case, order or account. Even without a name, linkage can make them personal data. Recommended decision:do not send them to general-purpose analytics; measure an aggregate category or status; handle diagnostics in a separate operational system with appropriate access and retention.5. Personal data and free text Examples: email name phone address search messageFree text is especially risky. Internal search terms can include names, medical issues, addresses or confidential phrases. Recommended decision:prevent the value from entering the URL; remove it from analytics payloads; check logs and third-party tools too; measure only a category or the fact that a search occurred, if needed.6. Secrets and tokens Examples: token code jwt signature password_reset inviteThese values must not be captured. They may grant access to an action or resource. Recommended decision:revisit the journey design; use short-lived, limited-use tokens when a URL is technically necessary; prevent logging; remove the parameter from the address promptly; exclude the page from analytics when controls are unreliable.Filter at several layers Layer 1: the application The best protection is not creating an excessive URL. Do not prefill forms with clear-text email addresses in the query string. Do not place customer IDs in marketing links. Do not copy free-form searches into the page title. This reduces exposure across every system, not only analytics. Layer 2: before the analytics request Build a cleaned representation: const current = new URL(window.location.href); const allowed = new Set([ "utm_source", "utm_medium", "utm_campaign", "utm_content", ]);const clean = new URL(current.origin + current.pathname);for (const [key, value] of current.searchParams) { if (allowed.has(key)) { clean.searchParams.set(key, value.toLowerCase().slice(0, 100)); } }const analyticsPage = clean.pathname; const campaign = Object.fromEntries(clean.searchParams);This illustrates the principle, not a universal implementation. You must also handle repeated keys, validate values, cap length, reject free text, test encoding, account for routing and ensure errors never fall back to the raw URL. Sending page path and campaign dimensions as separate fields is often safer. Layer 3: the collector or proxy Server-side validation protects against browser bugs and old scripts. Reject unknown fields, cap values and log only an error code without copying rejected data. This is important when many sites share an endpoint. Layer 4: the analytics platform Some platforms provide redaction or exclusion. GA4 can redact email patterns and administrator-defined query parameters. Matomo can exclude query parameters from page reports. These settings help, but they do not replace earlier controls. A value may cross a tag manager, log or proxy before being hidden in a report. Layer 5: exports Historical exports can retain values filtered later in the platform. Include warehouses, backups, CSV files and BI connectors in the deletion process. Your data collection summary should distinguish received, transformed, stored and exposed data. Normalise pages without losing useful context A content report should usually group variants of the same resource: /products?sort=price&page=1 /products?sort=name&page=1 /products?utm_source=newsletter /products?session=abcThe primary page dimension can remain: /productsUseful context can be separate: campaign_source=newsletter sort_used=trueThis creates readable reports and avoids high-cardinality dimensions. When the query defines the content Some applications use ?article=42 or ?category=security as the resource identifier. Removing it without replacement would merge distinct pages. Options include:migrating to stable paths such as /articles/42; deriving a controlled, non-personal content dimension.Do not preserve the raw identifier automatically. First assess whether it links to a person or case. SEO cleanup and analytics cleanup differ SEO teams may use canonical URLs, redirects, indexing rules and consistent internal links. Analytics teams choose the representation stored in reports. A canonical tag does not stop a script from collecting the full URL. Removing a parameter from analytics does not change search-engine crawling. Document the two decisions separately. A practical test protocol Test 1: parameter corpus Create test URLs with:approved UTM tags; an unknown key; an encoded email; a numeric identifier; a very long value; repeated keys; special characters; a dummy token; free-form search text.Test 2: network observation Inspect the exact browser payload. Search for the dummy sensitive value across every request, not just the primary analytics request. Test 3: logs and storage Check the collector, CDN, application errors and raw data. Absence from the dashboard does not prove the value was never stored. Test 4: reports and exports Inspect page reports, custom dimensions, API output and a representative export. Test 5: failure behaviour Disable a rule, send an unknown key and simulate an invalid payload. The system should fail safely without logging the full URL. Govern the allowlist Maintain a small register:Parameter Status Purpose Allowed values Owner Reviewutm_source Allowed Acquisition Marketing taxonomy Growth Quarterlyutm_medium Allowed Channel Closed list Growth Quarterlylang Derived Content fr, en Product Twice yearlyemail Forbidden None None Engineering Permanenttoken Forbidden Security None Security PermanentEvery new key must answer the same question: which decision justifies collection? For multi-site environments, use one common default allowlist and document every property-specific exception. Conclusion The right filter is not a long list of forbidden words. It is a simple policy:no personal data or secrets in URLs; a short allowlist for useful campaign signals; controlled dimensions for product needs; cleaning before transmission plus server-side validation; tests across network, logs, storage and exports.This improves privacy, security and report clarity at the same time. Measuring fewer URL variants often produces a better view of the pages that matter. FAQ Should analytics remove the entire query string? It is a sound default for the page dimension, but some applications use parameters to define content. Derive a controlled dimension instead of storing the raw URL. Can UTM tags contain an email address? No. Email addresses in URLs can spread across many systems. Use campaign categories, never person-level identifiers. Is GA4 redaction enough? It reduces specific risks inside GA4 but may not cover logs, other tags, proxies or exports. Filter as early as possible and verify every layer. Can a hashed identifier stay in the URL? Hashing does not automatically make data anonymous. If it can distinguish, link or recover a person, it may remain personal data and should not be transmitted without a justified design. How should internal search terms be handled? Avoid sending free text. Measure search usage, a controlled category or aggregate statistics after assessing the need. SourcesOWASP, Information exposure through query strings in URL MDN, URLSearchParams Google Analytics, Data redaction Matomo, Excluding URL query parameters from tracked URLs Regulation (EU) 2016/679, Article 25 and Article 5 principles EDPB, Guidelines on data protection by design and by default
- 25 May, 2026
UTM tags, referrers and direct traffic: read acquisition sources correctly
A rise in direct traffic does not necessarily mean more people typed your domain into a browser. A UTM-tagged visit does not prove that one campaign created the demand. A missing referrer does not prove that the visit had no source. These concepts appear in the same acquisition reports but describe different signals:UTM parameters are labels deliberately added to a URL; the referrer is information a browser may transmit; direct traffic is a classification used when the analytics system has no more specific usable source under its rules.Reliable reporting starts with that distinction. It also accepts that web attribution is a reconstruction from incomplete signals, not a complete history of a person's journey. UTM tags are declarations attached to a link A campaign URL might look like this: https://www.example.com/guide/?utm_source=newsletter&utm_medium=email&utm_campaign=launch_juneCommon parameters are:utm_source: the declared origin, such as linkedin, newsletter or a partner; utm_medium: the channel family, such as paid_social, email or referral; utm_campaign: the initiative name; utm_content: a creative, placement or link variant; utm_term: historically used for keywords, and best used only when there is a clear need.Google documents additional manual campaign parameters, but most small teams gain little from more dimensions. Three required fields and one optional variant are usually enough. UTM values are not detected by the browser. A person or system writes them into the link. Treat them as declared campaign metadata, with the strengths and weaknesses of any declared data. What UTM tags do well They help when the referrer is missing, generic or insufficient:newsletters; QR codes; PDF documents; email signatures; organic or paid social posts; partner campaigns; in-app links.They also distinguish two links to the same destination, such as a newsletter hero button and footer link. What they do not prove A UTM tag does not prove that the campaign caused all demand. It says that the measured visit arrived with that label. The URL may have been copied into a private channel, forwarded by a colleague, opened much later or altered by an intermediary. The visitor may have discovered the brand elsewhere first. Reports should therefore describe visits and conversions attributed under the measurement rule, not certain causality. The referrer is conditional browser information When a browser follows a link, it may send the HTTP Referer header to the destination. The historical misspelling remains part of the protocol. What is sent depends on referrer policy, protocol, browser, opening context and the source site's choices. The modern default policy, strict-origin-when-cross-origin, generally sends:the full URL for same-origin navigation; only the origin for HTTPS cross-origin navigation; no referrer when moving from HTTPS to HTTP.A site can apply a stricter policy, an app can open a webview, and redirects or privacy protections can remove the signal. Referrers are useful but never guaranteed. Referrer and UTM can coexist A visit may provide:referrer: linkedin.com; utm_source: linkedin; utm_medium: paid_social; utm_campaign: webinar_june.The analytics platform then applies its own precedence rules. GA4 exposes manual source, medium and campaign dimensions while channel groups follow documented rules that can evolve. Do not compare reports without checking scope. First-user source, session source and key-event attribution answer different questions. Direct means that no better source was assigned In everyday language, “direct” suggests a typed URL or bookmark. Those visits exist, but the channel can also contain visits whose source was lost. Common examples include:untagged links in mobile apps or messaging tools; local documents, PDFs and presentations; redirects that drop parameters; restrictive referrer policies; secure-to-insecure navigation; email campaigns without UTM tags; copied links shared in private channels; analytics deployment errors; URL cleanup before campaign parameters are read.A safer interpretation is:The platform did not assign this visit to a more specific source with the data available.A large direct share is not automatically a problem. It becomes an audit signal when it changes abruptly, concentrates on a campaign landing page, or differs unexpectedly between tools measuring the same scope. Build a controlled UTM taxonomy The main risk is not a missing tag. It is inconsistent naming that fragments reports. 1. Use a closed vocabulary for utm_medium The medium should represent a channel family. Keep a controlled list, for example: email paid_search paid_social organic_social partner affiliate display offlineDo not mix paid-social, paidsocial, cpc_social and social_paid. Platforms may treat case and spelling variants differently, and reports will often show separate rows. 2. Use source for a platform or partner Examples: linkedin google customer_newsletter partner_acme event_parisDo not put the campaign name in the source, or you lose the ability to compare the same source over time. 3. Give campaigns a readable structure A simple convention is: goal_offer_periodExamples: lead_demo_2026q2 launch_product_2026june retention_webinar_2026q3Choose one language, case and separator. Lowercase with underscores is easy to validate. 4. Reserve utm_content for useful variants Examples include:hero_button; footer_link; video_a; creative_02; partner_banner.Never use it for recipient information. 5. Centralise link generation A validated spreadsheet, small internal generator or controlled form removes most variants. Store destination URL, source, medium, campaign, optional content, owner, creation date and status. Never place personal data in UTM tags Query parameters spread across many systems. They may appear in:browser history; web-server and CDN logs; analytics tools; support tools; screenshots; copied links; some referrer data; exports and reports.Do not put an email address, name, phone number, customer ID, token or other person-level identifier in a UTM value. For example: utm_content=customer_12345 utm_campaign=renewal_alice@example.comThese values turn campaign metadata into a personal-data distribution channel. Use a category or creative variant, not a person. Your data collection summary should state which parameters are allowed, retained or removed. Five mistakes that distort reporting Using UTM tags on internal links Internal UTM tags can create new attribution or overwrite prior context depending on the platform. Use an event or internal dimension to compare navigation placements. Tagging everything without a question A tag is unnecessary when the referrer provides enough information and no variant needs to be separated. Campaign metadata should answer a decision, not simply add columns. Changing convention mid-campaign linkedin, LinkedIn and linkedin.com can become three rows. Correct naming at generation time and keep a change log. Cleaning the URL too early Removing visible parameters after capture can produce a cleaner address. Removing them before analytics reads them loses the campaign. Test execution order. Comparing tools without aligning definitions Platforms can differ in session definitions, attribution windows, source lists and precedence rules. A discrepancy is not automatic proof that one tool is broken. Diagnose a rise in direct traffic 1. Locate the change Inspect landing pages, devices, countries and time patterns. A home-page increase differs from a spike on a campaign-only page. 2. Review deployments Look for changes to redirects, routing, CMP behaviour, tag managers, analytics scripts or URL cleanup. 3. Audit live campaign links Open the actual links in emails, ads, profiles, QR codes and documents. Do not rely on the planning sheet. 4. Test the complete journey Follow the link in its real context: app, messenger, embedded browser, PDF or QR code. Inspect the collection request and final report. 5. Accept residual uncertainty Dark social and no-referrer contexts cannot be reconstructed with certainty without more intrusive tracking. Responsible analytics sometimes keeps an unknown bucket rather than manufacturing false precision. A minimal acquisition dashboard For a small B2B team, four views are often enough:visits by source and medium; landing pages by source; meaningful conversions by source; direct and unassigned trends.Add cost and revenue only when definitions and joins are reliable. An apparently precise ROAS built on incomplete identifiers may be less useful than a well-defined cost per qualified request. Review trends over several weeks. Low volumes make daily changes noisy. Conclusion UTM tags, referrers and direct traffic are not three versions of the same field. They are separate mechanisms that complement and sometimes contradict one another. A sound acquisition setup uses:a short, controlled UTM taxonomy; no personal identifiers in URLs; a realistic view of referrer limits; a cautious definition of direct; documented attribution rules; regular checks of the links actually distributed.The goal is not to eliminate all direct traffic. It is to make important campaigns readable without pretending to reconstruct every journey. FAQ What is the difference between utm_source and the referrer? utm_source is deliberately added to a link. The referrer is a signal the browser may send from the previous page. Either, both or neither may be present. Does direct traffic mean people already know the brand? Sometimes, but not exclusively. It also includes visits for which no usable source was assigned, including some apps, documents and untagged campaigns. Which UTM parameters are essential? For most teams, utm_source, utm_medium and utm_campaign are the baseline. Use utm_content for a meaningful variant and add other parameters only for a defined question. Should internal links use UTM tags? Usually not. They can disrupt attribution. Use dedicated events or dimensions for internal navigation. Can UTM parameters be removed after arrival? Yes, once they have been captured correctly. Test execution order and retain the values only according to your collection and retention policy. SourcesGoogle Analytics, Traffic-source dimensions, manual tagging and auto-tagging Google Analytics, Default channel group definitions MDN, Referer header MDN, Referrer-Policy header OWASP, Information exposure through query strings in URL CNIL, The six GDPR principles

- 18 May, 2026
Data collection summary: document what your analytics actually collects
Installing analytics can take minutes. Explaining exactly what it collects often takes much longer. The problem is not only volume. Information is scattered across the tracking plan, vendor documentation, consent manager, source code and cloud configuration. When somebody asks, “Do we transmit the full URL?”, “Is the IP address stored?” or “How long do we keep raw events?”, no single person may have a complete answer. A data collection summary is a short operational document that brings those answers together. It describes the collection that is actually deployed, not the collection implied by a marketing page. It is not legal advice, a replacement for a record of processing activities, or a privacy notice. It is the technical layer that helps keep those documents accurate. What a data collection summary is for The document answers one question:For every data point or signal, do we know where it comes from, why it is collected, where it goes, how long it remains and who can access it?Product teams can use it to challenge new events. Marketing teams can see which dimensions genuinely exist. Engineering teams gain a reference for filtering and transformations. A DPO or legal adviser can compare technical reality with compliance records. Management can see the operational debt behind audience measurement. GDPR principles include purpose limitation, data minimisation, transparency and storage limitation. The Regulation also requires information for individuals and, where applicable, records of processing activities. A data collection summary does not create or replace these duties. It makes the underlying facts easier to establish. It is not the record of processing activities The distinction matters. A record of processing activities describes processing at a governance level: purposes, categories of people and data, recipients, transfers, retention and security measures. A data collection summary goes closer to implementation. It may state that:the page URL is stored without its query string; an IP address is used briefly for a technical operation and not retained; a user-agent is reduced to a browser family; only utm_source, utm_medium and utm_campaign are retained; a form event is emitted only after validation; raw events and aggregate reports have different retention periods.A privacy notice translates the relevant facts into language for visitors. It should not become a copy of the technical inventory, but it cannot be accurate without one.Document Main audience Detail level PurposeRecord of processing Internal compliance Processing and categories Govern and demonstrate complianceData collection summary Product and engineering Fields, flows and controls Describe the deployed collectionPrivacy notice Visitors and users Clear public information Explain relevant processingTracking plan Product, marketing and engineering Events and rules Define what should be measuredThese documents complement one another. They should not contradict one another. The ten columns that make the document useful A spreadsheet is enough. The value comes from the columns and the update discipline. 1. Data point or signal Use concrete names: page path, referrer domain, device class, form event, site ID, UTM parameter, derived country or temporary IP address. Avoid broad labels such as “technical data”. They hide design choices. 2. Example value An example removes ambiguity: /pricing/, newsletter or demo_requested. Use synthetic examples, never real personal data. 3. Source State where the signal originates: browser, server, form, CMS, CDN, analytics script or imported system. This reveals indirect collection. A platform may receive a URL or HTTP header before your tracking code transforms it. 4. Operational purpose Connect the field to a decision. “Identify entry pages that lead to a demo request” is more useful than “marketing analysis”. If a field supposedly serves every purpose, the need has probably not been defined well enough. 5. Transformation before storage Document what is removed, truncated, aggregated or derived:stripping unapproved query parameters; normalising paths; reducing the user-agent; deriving coarse geography and discarding the IP address; hashing an identifier, while recognising that hashing is not automatically anonymisation; daily or monthly aggregation.This separates what the system receives from what it keeps. 6. Destination and processors List every relevant destination: collection endpoint, raw storage, aggregate database, BI tool, export, cloud provider and analytics vendor. Record hosting regions and relevant transfers when they are documented. Do not infer a legal location from a cloud region label alone. 7. Retention Separate the layers:technical logs; raw events; pseudonymised records; aggregate statistics; backups; manual exports.A single global period is often misleading. The CNIL notes that retention should follow the purpose and remain limited to what is necessary. For audience-measurement trackers that may fall within the French consent-exemption framework, it recommends a tracker lifetime of thirteen months and a maximum of twenty-five months for collected information. Those benchmarks do not replace an assessment of the actual setup. 8. Access Describe roles rather than only names: administrators, analysts, agency, support or hosting provider. Specify whether access covers aggregate reports, raw events or exports. “Marketing has access” is not enough when a shared account can download the entire dataset. 9. Consent or configuration dependency Keep this factual:collected only after a consent signal; disabled in strict measurement mode; enabled for defined campaigns only; subject to local ePrivacy assessment; used for limited audience measurement, provided every applicable condition is met.Do not write “exempt” without documenting scope, conditions and configuration. 10. Deletion and owner Explain how the field disappears: automated deletion, scheduled job, vendor purge, manual procedure, contract termination or export deletion. Add an internal owner and a last-review date. Without ownership, the summary starts ageing at the next deployment. A minimal SaaS exampleSignal Purpose Before storage Retention AccessPage path Understand content usage Query string removed, path normalised 25 months for reports Product, marketingReferrer domain Understand visit sources Origin only when transmitted 25 months Marketingutm_source Identify a declared campaign Values normalised to a taxonomy 25 months Marketingdemo_requested Measure a B2B conversion No form content transmitted 25 months Product, aggregate sales viewIP address Security and coarse geolocation Used temporarily, not stored in the event Documented technical period Restricted operationsUser-agent Technical distribution Reduced to browser and device categories 25 months ProductThe table proves nothing by itself. It must match the observed network traffic, source code and vendor settings. Start with a real tracker audit and compare the results with your minimal tracking plan. A five-step method Step 1: start with network traffic Open browser developer tools, reload representative pages and inspect requests. Test before and after each consent choice, across several journeys and devices. Record domains, payloads, URL parameters and events. The network panel shows what leaves the browser. It may not expose every server-side transformation, but it gives you a verifiable starting point. Step 2: inspect code and configuration Review the collector, tag manager, CMP rules, environment variables and filters. Generic vendor documentation does not tell you which options your site enabled. Check adjacent capabilities too: session replay, advertising enrichment, CRM connections, user identifiers and exports. Step 3: ask vendors closed questions Request testable answers:Is the full URL received and stored? Can query parameters be removed before storage? Is the IP address logged outside the event dataset? Which backups still contain data after deletion? Does the vendor reuse data for its own purposes? Which subprocessors and transfers apply? Do exports follow the same retention policy?“Privacy-friendly” fills no column. Step 4: reconcile the documents Compare the summary with the processing record, data-processing agreement, privacy notice and consent interface. Contradictions matter more than the writing quality of each document in isolation. A common example is a notice saying that only aggregate statistics are collected while the tag manager sends a user identifier to a third party. Step 5: tie review to change Review the summary whenever you add or change:a tool; an event; a collection domain; an export; a retention period; consent behaviour; a processor; a site or property.A light quarterly review can detect silent drift. Mistakes that make the summary unreliable Copying vendor marketing Vendor documents describe a possible product. Your summary must describe your instance and configuration. Treating pseudonymisation as anonymisation A hashed or rotating identifier may still be personal data if it can distinguish or reconnect a person. Use precise terms and document re-identification risk. Forgetting URLs Full URLs can expose email addresses, order IDs, internal search terms or tokens. Even a minimal analytics tool can receive excessive data when the website places it in the address. Documenting only the dashboard The visible report is only one surface. Logs, raw events, backups, exports and integrations count too. Leaving the document ownerless An accurate but unmaintained inventory can become more dangerous than no inventory because it creates misplaced confidence. Validation checklist Before approval, verify that:every field has a specific purpose; received and stored data are distinguished; URL parameters and free-text fields were audited; retention is defined by layer; recipients and access roles are named; consent and configuration dependencies are explicit; deletion can be tested; the summary matches public and contractual documents; an owner and review date are recorded; every anonymisation claim has technical evidence.Conclusion A data collection summary is not another document for a compliance folder. It is a shared interface between product, marketing, engineering and legal work. Its value comes from precision. A team that knows exactly what it collects can remove unnecessary fields, explain the useful ones, configure tools correctly and answer questions faster. Start with one web property and its ten most important signals. Verify them in the network and code, then expand only when the deployed collection justifies it. FAQ Is a data collection summary legally required? This exact format is not prescribed by the GDPR. It can support documents and processes that are required or necessary, including processing records and transparent information for individuals. Should it be public? Not necessarily. It often contains internal technical details. Relevant information for individuals should be expressed clearly in the privacy notice or another appropriate notice. Should a non-stored IP address be listed? Yes, if it is received or used even briefly. Distinguish receipt, temporary processing, transformation and storage. Can one summary cover multiple sites? Only when their flows and configuration are genuinely identical. For multi-site operations, maintain a common baseline and document property-specific differences. How often should it be reviewed? At every material collection or destination change, plus a periodic review. Quarterly review is a practical operating rhythm for a small team, not a universal legal rule. SourcesRegulation (EU) 2016/679, including Articles 5, 13, 25 and 30 CNIL, Record of processing activities CNIL, Audience-measurement cookies and consent conditions EDPB, Guidelines 4/2019 on data protection by design and by default Chrome for Developers, Network features reference OWASP, Information exposure through query strings in URL
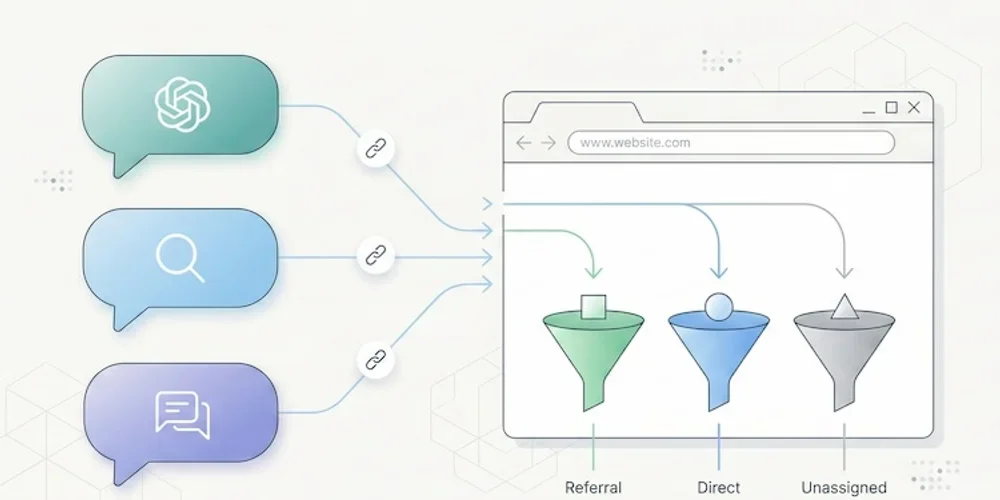
- 02 Feb, 2026
AI traffic: how to measure visits that ChatGPT, Perplexity and Claude send to your website
Something has shifted in the way people find your website. And chances are, you have no idea it's happening. Since late 2024, conversational AI platforms have moved beyond answering questions. They now cite sources, insert links, and send real visitors to real websites. ChatGPT, Perplexity, Claude, Gemini, Copilot: these tools are becoming a genuine discovery channel, one that rivals traditional search engines in the quality of traffic it delivers. The catch? Most analytics tools don't separate this traffic. It gets lumped into "referral," blends into "direct," or vanishes from reports entirely. You may already have visitors arriving through a ChatGPT recommendation, and your dashboard won't show it. This article gives you the full playbook: how to spot AI traffic, why it matters, and what to do about it. A new discovery channel, growing fast The raw numbers are still modest. But the trajectory is hard to ignore. A study by SE Ranking covering nearly 64,000 websites across 250 countries (January-April 2025) found that ChatGPT alone accounts for 78% of all AI referral traffic worldwide. Perplexity comes in at roughly 15%, Gemini at 6.4%. Claude and DeepSeek share the remainder at under 1% each, though both show compelling growth curves. (Source: SE Ranking, "AI Traffic in 2025") A separate analysis by Conductor, reported by Search Engine Land, confirms this hierarchy across 13,770 domains and 3.3 billion sessions: AI traffic averages about 1% of total site visits, with ChatGPT generating 87% of it. (Source: Search Engine Land, Nov. 2025) One percent sounds negligible. Two things make it anything but. Growth is strong, but still uneven. Between January and April 2025, ChatGPT's share of global internet traffic doubled in SE Ranking's study, from 0.08% to 0.16%. Some industry analyses also show strong year-over-year growth in AI referral traffic. These figures still need to be read by sector: they do not automatically make AI the first acquisition channel for every site. Traffic quality can be interesting. Visitors arriving from AI platforms spend an average of 9 to 10 minutes per session in SE Ranking's study, compared to 3 to 4 minutes for organic search. Claude-referred sessions in that dataset reached a very high average duration in the EU. These are signals to inspect, not a conversion guarantee: each team should verify landing pages, useful events, and conversions in its own data. The logic is straightforward: a user who clicks a link inside an AI response has already asked a specific question, received context, and chosen to visit your site from among the cited sources. Their intent is pre-qualified. They know why they're coming. Why your analytics can't see it If AI traffic is this valuable, why doesn't it show up clearly in your reports? Three technical issues create this blind spot. The missing referrer problem When someone clicks a link in Perplexity from a web browser, the HTTP Referer header typically passes perplexity.ai as the source. Your analytics tool can then classify the visit as a referral from Perplexity. But this mechanism does not always work. Depending on the context, some sessions from AI tools may not pass a usable referrer. The reasons vary: mobile apps (ChatGPT on iOS, Copilot in Windows) may open links in internal webviews, some AI agents prefetch or preview pages without triggering the analytics script, and AI browsers such as Perplexity Comet or ChatGPT Atlas do not all pass signals the same way. (Source: MarTech, Nov. 2025) The result: a significant portion of AI traffic falls into the "direct" or "unassigned" bucket in your analytics, invisible and unattributed. GA4's default classification Google Analytics 4 can classify visits from AI assistants as "referral," the same category as a link from Facebook, a forum, or a directory listing. In the setups observed when this article was first written, teams still needed their own grouping to isolate this traffic. Always verify the current GA4 interface before documenting the procedure. In practice, if you open your acquisition report in GA4 without custom configuration, ChatGPT traffic is buried among dozens of other referral sources. For a site receiving hundreds of different referrers, spotting chatgpt.com or perplexity.ai requires knowing what to look for. The bot-vs-human confusion AI platforms interact with your site in two fundamentally different ways. The first is referral traffic: a human clicks a link in an AI response and lands on your page. This is real traffic with a real visitor. The second is crawling: AI platform bots (GPTBot for OpenAI, PerplexityBot, ClaudeBot, and others) visit your site to index content and feed their models. This crawl traffic is not useful audience data. It's data harvesting. GA4 automatically filters known bots, but the list isn't comprehensive. Some newer AI bots slip through, while some legitimate human visitors from AI tools get incorrectly filtered. Cloudflare has observed crawl-to-referral ratios as high as 700:1 for Perplexity, which gives a sense of how much harvesting activity exists relative to actual human visits. (Source: Digiday, Dec. 2025) How to identify AI traffic in your tools Two approaches work, depending on what you're using. In GA4: create a dedicated "AI Traffic" channel The recommended method is to build a custom channel group that aggregates all known AI sources. Here's the process:In GA4, go to Admin > Data Settings > Channel Groups. Click the default channel group, then "Copy" to create a new one. Add a channel called "AI Traffic." Set the rule: Match type = "matches regex", then paste this pattern:(chatgpt\.com|chat\.openai\.com|perplexity\.ai|claude\.ai|gemini\.google\.com|copilot\.microsoft\.com|deepseek\.com|meta\.ai)Drag your "AI Traffic" channel above the default "Referral" channel in the priority order. This is critical: GA4 evaluates rules top-down, and if "AI Traffic" sits below "Referral," visits will be classified as referral before reaching your rule.This setup only applies to new data (no retroactive effect). Allow a few days before results appear. For a one-time analysis of historical data, create an Explore report with a filter on "Session source" using the same regex. (Source: MarTech, Nov. 2025) In a lightweight analytics tool (Plausible, Fathom, etc.) This is where a well-designed simple tool can help. In Plausible, the "Sources" report displays every identified referrer directly. If chatgpt.com or perplexity.ai appears as a source, you can inspect it without creating a custom channel first. Click the source to filter the dashboard by that origin and analyze entry pages, time on site, and triggered events. Plausible documented its own experience: in 2024, the Plausible blog saw a 2,200% surge in AI referral traffic within months, all identifiable from their standard dashboard with zero configuration. (Source: Plausible, Dec. 2024) This is a textbook case where the frugal analytics philosophy helps: when a tool is designed to surface essential data without layers of configuration, emerging signals are easier to inspect. A tool like GA4 remains powerful, but it often requires dedicated configuration to isolate a new family of sources. For a broader view of analytics tool families, see our Google Analytics, Matomo, and frugal analytics comparison. AI referral traffic vs AI crawling: two different things A common mistake is conflating referral traffic (humans clicking) with crawling (bots scraping). They deserve separate attention because they raise different questions. AI referral traffic is an opportunity. It represents a qualified, pre-informed visitor arriving with intent. Measuring it lets you optimize landing pages, adapt content, and understand how AI platforms perceive your site. AI crawling is a governance question. Bots like GPTBot, PerplexityBot, and ClaudeBot visit your site to train their models or answer user queries in real time. Some do so aggressively: Cloudflare found that GoogleBot's crawl volume (which also feeds Gemini) dwarfs that of all other AI bots combined. You can control crawling through your robots.txt file: User-agent: GPTBot Disallow: /User-agent: PerplexityBot Disallow: /User-agent: ClaudeBot Disallow: /But beware the paradox: blocking the crawl can reduce your referral traffic. If an AI can't index your content, it can't recommend it to users. This is a trade-off to make deliberately. An emerging approach uses an llms.txt file (a Markdown file placed at your site's root) to guide AI platforms toward the content you want to make accessible, without blocking all crawling. Anthropic (the company behind Claude) uses this mechanism on its own site. How to get cited by AI platforms Understanding AI traffic also means understanding what triggers it. AI platforms don't cite sites randomly. Several factors drive citations. Content structure matters. Analyses cited by Superprompt suggest that pages with clear heading hierarchies (H2, H3, lists) and direct answers are easier for AI systems to reuse. Structured FAQ sections are particularly useful because they match the question-and-answer format of AI interactions. Freshness can help. Recently updated content is often easier to use in answers that need current information. The effect still depends on topic, domain authority and how the AI platform retrieves sources. Original data attracts citations. Data tables, proprietary statistics and exclusive benchmarks can be easier to cite than generic content. This is another argument for precise, data-driven KPIs over vanity metrics. Traditional SEO remains the foundation. Several market studies connect AI visibility with conventional SEO signals: structure, authority, freshness and editorial clarity still matter. SEO doesn't depend on Google Analytics, but it remains part of the foundation for AI visibility. What this means for choosing an analytics tool AI traffic exposes an operational limit in complex analytics platforms: emerging signals often need prior configuration before they are easy to read. With GA4, you need to create a channel group, write a regex, update it regularly (new AI tools launch every month), and accept that the data won't be retroactive. It's doable, but it demands technical expertise that most small business owners and freelancers simply don't have. With a well-designed lightweight analytics tool, AI referrers can appear directly in the sources report, right alongside Google, LinkedIn, or Twitter, when the referrer is actually transmitted. That does not remove webview, direct or prefetch limits, but it makes visible signals easier to read. That's the core principle of analytical sobriety: collect less data, but make every data point immediately readable. AI traffic is not something to ignore. It is one signal of a change in how some people discover content online. Sites that measure it today will mostly have a clearer read on emerging sources, without overstating a volume that often remains small. The question is no longer whether AI platforms send traffic to your site. It's whether your measurement tool shows it to you.Frequently asked questions What percentage of my traffic comes from AI? Late-2025 studies still place identifiable AI traffic at a small share of total traffic, with large variations by sector. That only reflects identifiable traffic: when an AI session lacks a usable referrer, it can fall into "direct" and remain difficult to attribute. How do I see ChatGPT traffic in Google Analytics 4? If your GA4 interface does not yet provide an AI channel that fits your needs, create a custom channel group: go to Admin > Data Settings > Channel Groups, add an "AI Traffic" channel with a regex rule covering AI domains (chatgpt.com, perplexity.ai, claude.ai, gemini.google.com, copilot.microsoft.com). Place it above the "Referral" channel in the hierarchy. Data will only be collected from the date you create the channel. Should I block AI bots with robots.txt? It's a trade-off. Blocking AI bots (GPTBot, PerplexityBot, ClaudeBot) via robots.txt prevents your content from being indexed by these platforms, which may reduce citations and referral traffic. On the other hand, not blocking means your content feeds AI model training, raising intellectual property and consent questions. A middle-ground approach uses an llms.txt file to guide AI platforms toward the content you want them to access. Can cookieless analytics detect AI traffic? Yes, when a usable referrer is transmitted. Cookieless tools like Plausible, Fathom, or Simple Analytics can display those referrers directly in their sources report without a dedicated channel group. That is often easier to inspect, but it does not solve referrer, direct or prefetch limits. How do I optimize my content to get cited by ChatGPT or Perplexity? Five levers are worth testing: structure content with clear headings (H2/H3) and FAQ sections; keep content fresh when the topic requires it; produce original data (tables, statistics, benchmarks); maintain strong traditional SEO; and consider an llms.txt file to make structured content easier for AI crawlers to access. Effects vary by platform and topic, so document your assumptions before turning them into an editorial rule.Sources and figures were checked for the initial February 2026 publication. AI traffic shares and GA4 classifications evolve quickly: verify the current interface and documentation before turning this into an internal rule. Sources Sources checked on May 10, 2026.SE Ranking, "AI Traffic in 2025: Comparing ChatGPT, Perplexity & Other Top Platforms" Search Engine Land, "AI sends 1% of website traffic — and most of it is from ChatGPT" MarTech, "How GA4 records traffic from Perplexity Comet and ChatGPT Atlas" Plausible Analytics, "Breaking down our 2.2K% surge in AI traffic"