Multi-site analytics dashboard: manage 5, 10 or 30 websites without losing clarity
- 08 Jun, 2026
Tracking one website is a measurement problem. Tracking ten becomes a governance problem.
Each team initially creates its own analytics property, event names and dashboard. Months later, the group has ten definitions of “conversion”, three time zones, incompatible campaign taxonomies and accounts with unclear ownership.
The missing piece is not another chart. It is a shared structure.
A useful multi-site dashboard must support two movements:
- compare properties on a consistent baseline;
- drill into each site without erasing its business context.
Combining everything creates an abstract average. Separating everything hides the portfolio. The right architecture preserves both levels.
Start with a property map
List every site and its role before choosing metrics.
| Property | Role | Main audience | Meaningful conversion | Owner |
|---|---|---|---|---|
| Corporate site | Trust | Prospects, partners | Qualified contact | Communications |
| Product A | Acquisition | SMBs | Demo request | Growth A |
| Product B | Acquisition | Mid-market | Meeting booked | Growth B |
| Help centre | Support | Customers | Self-service resolution | Support |
| Blog | Discovery | B2B audience | Signup or product visit | Content |
Sites with different purposes should not be ranked only by traffic. A help centre can perform well by reducing support demand even when it generates no demos.
The map should also record:
- domains and subdomains;
- production environment;
- analytics tool and property ID;
- time zone;
- currency where relevant;
- creation date;
- business owner;
- technical owner;
- access list;
- collection mode;
- retention;
- active, migrating or archived status.
This becomes the reference inventory.
Define a common measurement contract
The multi-site baseline is not a dashboard. It is a compact measurement contract applied to every property.
Common dimensions
Use shared definitions for:
- page or path;
- referrer domain;
- source, medium and campaign;
- country or region;
- device class;
- date and time zone;
- primary events;
- conversion status.
Apply one URL parameter policy and one UTM taxonomy.
Common events
A small library is enough:
form_submitted
demo_requested
signup_completed
download_completed
outbound_clicked
search_used
Every event needs a definition, trigger, allowed properties, owner, test and version.
One name must not represent different actions. Conversely, three names for the same contact request prevent comparison.
Common quality rules
Document:
- test-environment filtering;
- bot handling;
- internal-domain handling;
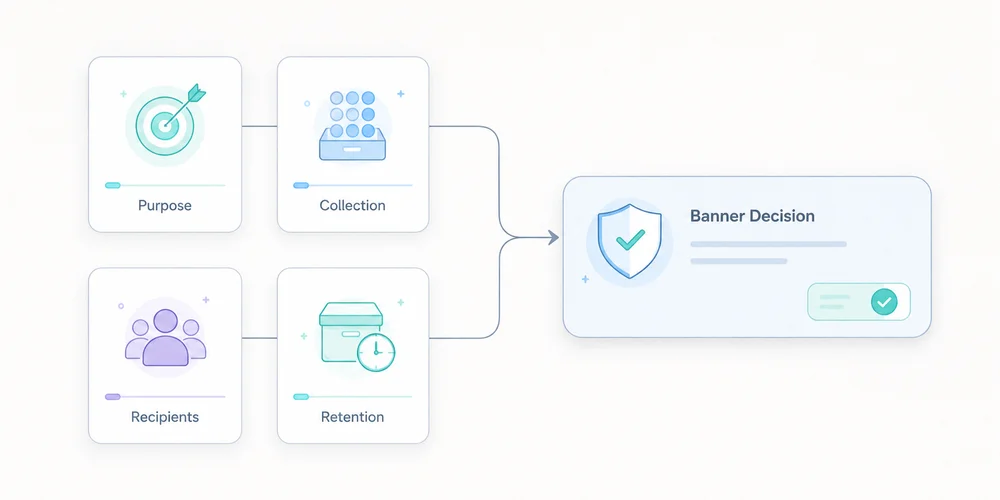
- consent and collection modes;
- path normalisation;
- time zone;
- deployment process;
- alert thresholds.
The data collection summary can hold the shared baseline and property-specific exceptions.
Separate three reading levels
A sound multi-site system does not put every chart on one page.
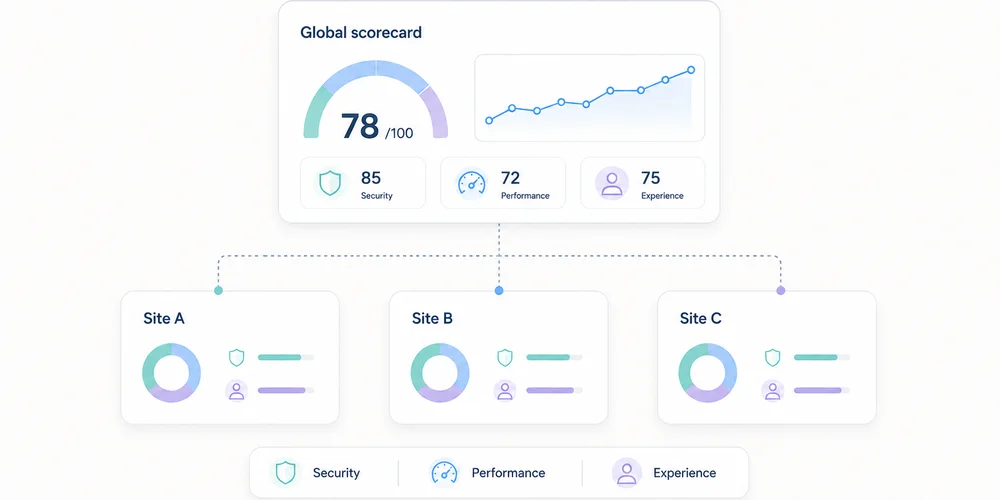
Level 1: portfolio view
This answers management questions:
- Which sites gain or lose useful traffic?
- Where are conversions moving?
- Which property has an anomaly?
- Which team needs investigation?
- Which site stopped sending data?
Keep it short. A table with one row per property is often more useful than twenty small charts.
| Site | Visits | Change | Useful conversions | Rate | Main channel | Data status |
|---|---|---|---|---|---|---|
| Corporate | 24,500 | +6% | 132 | 0.54% | Organic | OK |
| Product A | 18,100 | -4% | 284 | 1.57% | Paid search | Review |
| Product B | 9,600 | +12% | 96 | 1.00% | Partners | OK |
| Help | 41,000 | +2% | n/a | n/a | Direct | OK |
Figures are illustrative. Data status matters: a fall means something different when collection broke.
Level 2: property view
Each site retains its business dashboard:
- acquisition;
- landing pages;
- content;
- conversions;
- events;
- trends;
- data quality.
A SaaS property may track trials, while a help centre tracks unsuccessful searches or support escalation.
Level 3: diagnostics
Analysts and engineers need:
- events by version;
- collection errors;
- unknown parameters;
- client/server discrepancies;
- time-series breaks;
- unexpected domains;
- test traffic;
- ingestion delay.
Keep diagnostics out of executive reporting, but do not omit them. Otherwise every anomaly becomes a manual investigation.
KPIs that can be compared
Visits and page views
They show scale but naturally favour larger sites. Always include trend and context.
Common meaningful conversions
A shared conversion group can include demo requests, qualified contacts, verified signups or confirmed purchases.
Preserve the conversion mix too. A total can hide a shift toward lower-value actions.
Conversion rate
Rates compare different property sizes only when the denominator is identical. Document whether it uses visits, visitors, sessions or landing-page entries.
Channel share
Organic, paid, email, partner, referral and direct shares reveal dependence. This requires one campaign taxonomy.
Collection health
Add technical KPIs:
- time of last received event;
- event-volume change;
- rejected-event share;
- unknown parameters;
- pages missing path or title;
- abrupt direct-traffic movement.
Data reliability is a governance KPI.
What not to add naively
Unique visitors
The same person can visit several domains. Adding each site’s unique visitors counts them more than once.
A global identifier for deduplication materially changes collection. The CNIL notes that using the same identifier across several sites for global tracking falls outside the French consent-exemption conditions it describes for certain audience-measurement trackers.
A lightweight report can instead use:
- visits by property;
- a clearly labelled non-deduplicated reach sum;
- or an aggregate method that does not require a person-level cross-site identifier.
Heterogeneous conversions
A brochure download is not automatically equal to a sale. Show a common total and its composition.
Simple averages
An average of ten conversion rates gives equal weight to a site with 100 visits and one with 100,000. Use a weighted overall rate or show the distribution.
Unaligned periods
Time zones and campaign calendars can move events between days or weeks. Normalise time before comparison.
Compare without punishing small sites
Multi-site views easily become rankings. That is rarely helpful.
Use four axes:
- current level;
- change over time;
- local target;
- measurement confidence.
A niche site can have low volume, healthy growth and high-value outcomes. A large site can hide paid-channel dependence or broken tracking.
Trends and comparison bands are more useful than a podium.
Structure access
Multi-site operations increase excess-access risk.
Define roles:
- portfolio owner: sees all properties and manages standards;
- site owner: administers one property;
- analyst: views and exports as needed;
- contributor: sees reports without changing collection;
- agency or partner: access limited to contracted properties;
- technical support: temporary, logged access when required.
Avoid shared accounts. Review access quarterly, remove access at contract end and apply least privilege.
Establish a governance cycle
Weekly: monitor health
Automate simple alerts for no data, abnormal shifts, unknown domains, rejected events and sudden direct-traffic changes.
Monthly: discuss decisions
Ask property owners:
- What changed?
- What action follows?
- Which hypothesis will be tested?
Reporting should not become a reading of numbers.
Quarterly: review the contract
Check common events, UTM naming, inactive properties, access, retention, vendors, configuration differences and business goals.
At launch: use a checklist
Before adding a site:
- assign owners;
- set time zone;
- apply the collection baseline;
- configure filters;
- test events;
- verify consent behaviour;
- add it to the portfolio;
- document exceptions;
- create alerts;
- schedule the first review.
Choose an architecture
One property per site
This is usually clearest for access, retention and configuration. It requires a portfolio layer for comparison.
One shared property with a site dimension
It can simplify some reports but mixes permissions, configurations and collection risks. One mistake affects the full dataset.
One property per site plus a consolidated view
This is often the best compromise: operational separation with portfolio aggregation. Some vendors provide roll-up or consolidated views. Verify plan requirements, deduplication method, permissions and exactly which data are combined.
The key factor is not only the number of sites. It is their independence across teams, brands, purposes, regions, access and privacy settings.
A one-page dashboard model
Top strip
- portfolio visits;
- useful conversions;
- weighted overall rate;
- healthy property count;
- open anomaly count.
Central table
One row per property with trend, conversion, channel and status.
Acquisition block
Channel shares by site.
Content block
Top landing pages and rising pages, filterable by property.
Quality block
Missing data, rejected events, access reviews and recent deployments.
Each block links to a detailed view. The portfolio dashboard signals; it does not explain everything.
Conclusion
Multi-site measurement works when governance comes before visualisation.
You need:
- a clear property map;
- a common measurement contract;
- documented exceptions;
- three reading levels;
- comparable indicators;
- restricted access;
- a review cycle;
- consolidation that does not force person-level cross-site tracking.
The best dashboard does not make every site identical. It gives them a shared language while preserving their role.
FAQ
Should every website have its own analytics property?
It is often the clearest way to separate access and configuration. A consolidated view can compare them. A shared property can work when purposes and permissions are genuinely shared.
Can unique visitors be added across sites?
Not as deduplicated reach. One person can appear in several properties. Label the number as non-deduplicated or use an appropriate aggregate approach without introducing a global identifier by default.
How many KPIs belong in the portfolio view?
Five to eight well-defined columns are usually enough: volume, trend, conversion, rate, main channel and collection health. Details belong in property views.
How should different site goals be handled?
Keep a small common baseline and add local indicators. Compare each site with its own target and trend, not only with other sites.
How often should access be reviewed?
Quarterly review is a reasonable practice, with immediate removal when employees or vendors leave.