Tag: Kpis
All blog posts with this tag.
- 20 Jul, 2026
Acquisition pages: seven signals to track without building an analytics maze
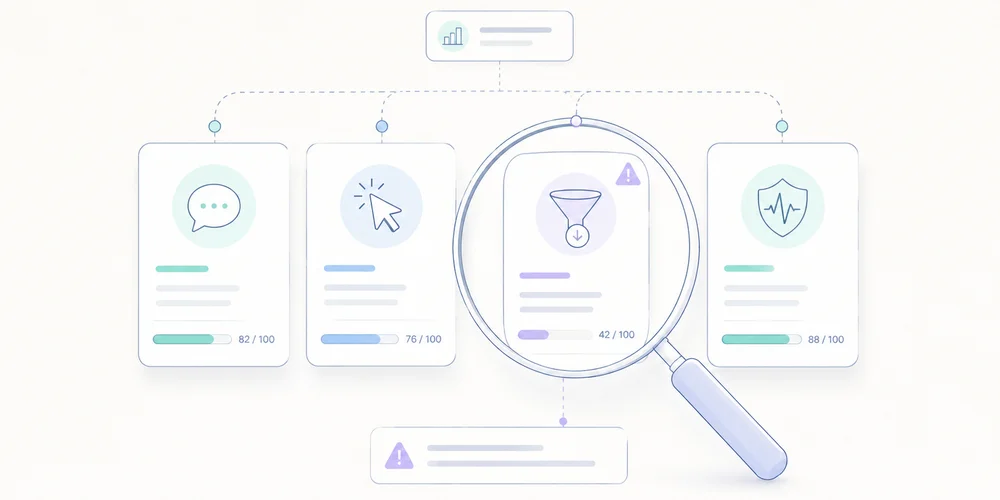
An acquisition page does not need fifty metrics to be managed well. It needs to answer a short chain of questions:are the right people arriving? do they understand the proposition? do they move toward the intended action? do they complete it? are the resulting leads or sales useful? does the page work properly? is the measurement reliable enough to support a decision?This chain prevents two common mistakes. One is judging a page only by traffic volume. The other is adding behavioural events without connecting them to a business decision. For an SME or B2B SaaS team, seven signals are usually enough for a sound diagnosis. Define the page's job before its metrics Not every acquisition page has the same objective. A page may aim to:generate demo requests; start trials; collect quote requests; sell a product; deliver a resource; register attendees; move visitors to pricing; qualify a need before a sales conversation.Its primary KPI follows from that job. An educational content page should not be judged like a demo page. An awareness campaign should not be read like high-intent search. Document four elements first:Element QuestionAudience Who is the page for?Promise Which specific problem does it solve?Source Which channel or campaign brings visitors?Action What useful action should follow the visit?This short brief becomes the reference point when the numbers change. Signal 1: qualified entries by source The first signal is not raw session volume. It is the distribution of entries by source, campaign and intent. Two hundred visits from a precise query may be more useful than two thousand loosely targeted visits. Conversely, low volume does not prove quality if none of the visitors belong to the intended segment. Review at least:visits or sessions starting on the page; source and medium; campaign; identified ad or link content; organic query where Search Console provides it; country or commercial region when genuinely relevant; direct traffic, interpreted cautiously.GA4's Landing page report associates the first pageview in a session with metrics such as sessions and key events. It can also use Session source / medium as a secondary dimension. Search Console complements this view for Google Search with clicks, impressions, CTR, position, queries and pages. The tools do not measure the same thing. Search Console describes visibility and clicks in Google results. Analytics describes activity observed after arrival, within its collection limits. Their totals should not be expected to match visitor by visitor. For campaigns, a stable UTM convention matters more than a sophisticated dashboard. Our guide to UTMs, referrers and direct traffic explains how inconsistent labels fragment reports. Signal 1: Decision question Is the page attracting the audience its message was designed for? Signal 2: intent-to-message fit A page can receive relevant traffic and still fail because its promise does not match the reason behind the click. Compare:the ad copy; the keyword or query; the newsletter link; the visible headline; the supporting proof; the requested action.Someone clicking “compare analytics tools for multiple websites” should encounter that topic immediately. Opening with generic digital-transformation language creates a gap even when the design is polished. No single rate captures this signal. Use several clues:conversion by source or campaign; primary CTA clicks; movement toward the expected section; very fast exits, interpreted cautiously; feedback from sales or support; focused user tests.Engagement time can flag an anomaly, but it is not proof of interest. A long duration may mean close reading or confusion. A short duration may mean abandonment or an immediate answer. Signal 2: Decision question Does the visitor clearly find the promise that brought them to the page? Signal 3: primary call-to-action activity The primary CTA is the first observable commitment toward the objective. Track an action that matters, such as:clicking Request a demo; opening a form; moving to pricing; adding to cart; starting a trial; confirming a download; scheduling a meeting.Do not label every click as a conversion. Accordion opens, tab clicks and scroll depth can support diagnosis, but they do not carry the same intent as a commercial action. A useful measurement sequence is usually:page entry; primary CTA click; form or flow start; successful completion.This separates a messaging weakness from a form problem. If few visitors click, investigate what happens before the CTA. If many click but few finish, inspect the next step. A minimal analytics tracking plan helps keep those definitions stable. Signal 3: Decision question Does a sufficient share of qualified visitors choose to continue? Signal 4: conversion completion The final conversion is the action the business considers useful. It must be unambiguous. Examples include:an accepted form submission; a confirmed appointment; an account creation; a completed payment; an activated trial; a delivered download.Always name the denominator. “Eight per cent conversion” is meaningless without knowing whether it refers to visitors, sessions, form opens or CTA clicks. For a form, measure at least:opens; starts; errors; abandonment; successful completion.Do not send field values to analytics. Form content may contain names, email addresses, phone numbers, free text and other personal data. The business system needs the content. Analytics usually only needs a technical or functional status. Signal 4: Decision question Where does the journey lose people who already expressed intent? Signal 5: post-conversion quality A page can achieve a strong conversion rate and create poor commercial outcomes. For B2B teams, the decisive signal often appears after the form:fit with the target profile; a request genuinely related to the product; an attended meeting; an opportunity created; continued sales progression; revenue or value created; spam and off-target demand.Connect acquisition to the CRM with proportionate granularity. You do not always need to send personal CRM data back into analytics. An aggregate table by campaign, source or landing page may be enough to answer which entries produce useful demand. Agree on a short sales classification:qualified; unqualified; duplicate; spam; outside market; no next step; opportunity.This prevents marketing from optimizing only for form volume. Signal 5: Decision question Does the page create useful outcomes rather than submissions alone? Signal 6: technical performance and errors A slow or unstable page can damage the experience before the message is evaluated. Core Web Vitals provide three field indicators:LCP for main-content loading; INP for interaction responsiveness; CLS for visual stability.Complement them with operational checks:JavaScript errors; forms that cannot submit; blocked resources; mobile CTAs hidden by layout; incorrect redirects; a 404 after submission; missing or duplicated tracking; consent logic applied incorrectly; abnormal server response time.Do not confuse correlation with causation. A technical improvement may accompany a conversion increase without being its only cause. Use performance data to identify differences by device, release and period. Signal 6: Decision question Is a technical constraint preventing part of the audience from progressing? Signal 7: measurement health The seventh signal concerns the data itself. Before interpreting a change, verify:event volume relative to visits; duplicated tags; consent changes; missing or inconsistent campaign parameters; redirects that lose parameters; sensitive values in URLs; form changes; releases during the period; time-zone differences; internal filters and exclusions.A 30 per cent increase may come from a successful campaign, a duplicated event or a changed definition. Document measurement changes before assigning a business cause. Our guide to privacy-first URL parameter filtering helps prevent identifiers and sensitive values from entering reports. Signal 7: Decision question Does the observed change describe the market, or a change in the measurement system? A minimal dashboard A landing-page dashboard can use this structure:Block Primary measure Useful breakdownAudience Qualified entries Source, campaign, deviceMessage CTA clicks / entries Source, variantJourney Starts and completions Step, deviceOutcome Useful conversions Campaign, segmentQuality Qualified leads Source, pageTechnical Vitals and errors Device, releaseMeasurement Documented anomalies Date, deploymentLimit comparisons to segments that can lead to action. A filter that changes no decision adds complexity without improving control. Review cadence Weekly Check:traffic breaks; form errors; misattributed campaigns; extreme changes; mobile problems; performance incidents.Monthly Review:source quality; conversion trends; lead quality; pages and campaigns to improve; tested hypotheses; decisions made.Put the conclusion into the monthly web report rather than sending a separate export from each tool. Metrics not to over-interpret Bounce rate Its definition varies by tool and context. A short visit to a page that answers a question immediately is not necessarily a failure. Scroll depth It may show how far content was traversed, but not what was understood. It is useful for comparing variants, not for proving intent. Time on page It combines attention, confusion, abandoned tabs and measurement constraints. Heatmaps They can help form a hypothesis, but they do not replace conversion data or user research. They also involve more detailed collection that should be assessed separately. Click volume It only matters when the action matches an explicit objective and the event is not emitted more than once. Conclusion An acquisition page should be managed as a chain, not as a ranking of metrics. The seven useful signals are:qualified entries; intent-to-message fit; CTA activity; conversion completion; post-conversion quality; technical performance; measurement health.Start with this structure. Add a metric only when it answers a question the team is prepared to act on. FAQ What is the primary KPI for a landing page? It is the useful action defined for that page: a qualified request, trial, purchase, meeting or another explicit result. Traffic and engagement mostly explain that result. Should scroll depth be measured? Only when it tests a specific hypothesis, such as whether an important proof point is rarely reached. Scroll should not be treated as a conversion. Why do GA4 and Search Console show different figures? They measure different stages and scopes. Search Console measures appearances and clicks in Google Search. GA4 measures sessions or events observed on the site, according to its setup and consent choices. How can a landing page be connected to revenue? Preserve source, campaign and landing-page context in the CRM or a controlled attribution table, then analyse aggregate cohorts. Avoid sending unnecessary personal CRM data back to analytics. How many events should be tracked? For most B2B pages, four levels are enough: entry, CTA click, journey start and success. Add diagnostic events only when they address a known problem. Sources Sources checked on June 21, 2026.Google Analytics, Landing page report Google Search Console, Performance report web.dev, Web Vitals Google Analytics, collect campaign data with custom URLs CNIL, cookies and other trackers
- 13 Jul, 2026
Monthly web reporting: build a report leadership will actually read
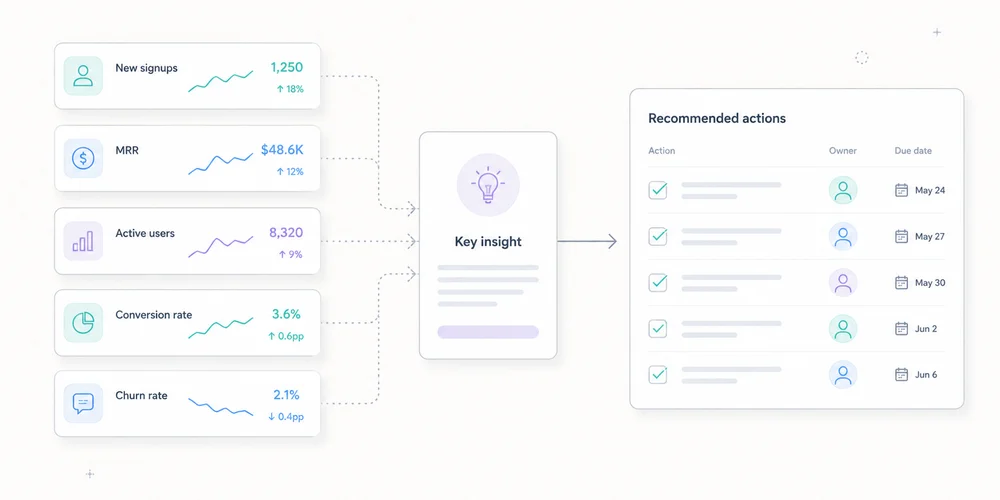
A web report can contain forty pages and produce no decision. Leadership rarely lacks charts. It lacks clear answers to five questions:What changed? Does it matter? Why do we think it changed? What action follows? Can we trust the data?Monthly reporting should be a decision document, not an archive of every available metric. A strong version has one main page, with appendices for investigation. It uses no more than five coherent indicators, contextualised changes and assigned actions. What monthly reporting is for A dashboard answers questions on demand. A monthly report establishes a shared reading at a point in time. It supports goals, detects gaps, explains known changes, records hypotheses, signals measurement limits and coordinates marketing, product, sales and engineering. It should not prove that the analytics team worked. Data volume is not decision quality. Start with the reader Leadership needs trend, target gap, business impact, risk, decision, owner and deadline. Operational teams need channel, page, campaign, event, segment, anomaly and methodology detail. Create two layers:decision summary; diagnostic appendices.The first must make sense without opening a dashboard. A seven-block format 1. One summary sentence Lead with the message, not total traffic. Example:Demo requests increased 18% on stable traffic, mainly through two organic landing pages. Lead quality still needs confirmation through the sales cycle.It contains result, comparison, likely mechanism and limitation. Avoid:The site recorded 42,847 sessions.Without a goal or comparison, the number says little. 2. Three to five KPIsMetric Month Change Target StatusQualified visits 18,240 +4% 18,000 MetDemo requests 126 +18% 120 MetVisit-to-demo rate 0.69% +0.08 pp 0.65% MetSales-accepted leads 61 +7% 70 BelowCollection incidents 2 +2 0 FixStatus follows a defined rule, not decorative colour. For B2B SaaS, the chain might be qualified audience, web conversion, sales quality, acquisition efficiency and measurement health. For content sites, use relevant organic entrances, useful engagement, product transition, signup and technical coverage. A portfolio can use the multi-site governance view as a common baseline with local metrics. 3. Significant changes Do not comment on every row. Select three to five movements above normal noise. Examples:conversions up 22% from one landing page; paid search down after budget reduction; direct traffic up on an untagged email campaign; Search Console impressions changed after a measurement or visibility shift; six hours of missing events; mobile improvement after a performance release.For each, record: Observation Magnitude Scope Hypothesis Evidence ConfidenceThis prevents correlation from becoming certainty. 4. Explanations and confidence Classify explanations:confirmed: documented deployment, budget change or outage; probable: several signals agree; possible: hypothesis to test; unknown: insufficient data.Example:Organic conversions probably increased because two pages gained both Search Console clicks and analytics entrances. Confidence: medium. Sales quality will be available after lead review.Confidence language is more honest than invented causality. 5. Decisions and actionsAction Owner Deadline Success measureApply the proof block to two product pages Content 25 July +10% conversion on tested pagesFix newsletter tagging Growth 15 July Direct share returns to normal on landing pageAudit event loss Engineering 10 July No collection gaps for 30 daysAn action without an owner is an intention. One without success criteria is a task without learning. 6. Data quality Add a visible box: Overall confidence: medium to high Known coverage: public site, excluding customer app Incidents: 6-hour loss on 12 June Changes: new CMP on 18 June Method break: qualified-lead definition changed 1 June Missing data: last 5 days of sales qualificationDo not hide quality in a footnote. Credibility improves when the report says what it does not know. 7. Appendices Appendices can cover sources, landing pages, campaigns, events, Search Console, web performance, segments, methodology, definition history and dashboard links. They support diagnosis, not the main reading. Choose five indicators Connect every KPI to a decision Ask what changes if the metric rises or falls. A metric with no possible action is probably descriptive. Define numerator and denominator A conversion rate can mean conversions per session, visitor, landing-page entry or started form. Write the formula and flag definition changes. Separate volume, efficiency and qualityvolume: demo requests; efficiency: conversion rate; quality: sales-accepted requests.Higher volume with lower quality is not automatically better. Add a reliability metric Examples include valid-event share, time without data, properties in error, consent coverage, unattributed traffic and CRM qualification delay. Measurement has its own performance. Compare the right periods Use previous month for operations, prior year for seasonality when comparable, target for relevance, and moving averages for low-volume trends. Two comparisons are usually enough: June 2026 vs May 2026 June 2026 vs monthly targetNormalise days, working days, time zone, currency, conversion definition, site scope, consent, campaigns and incidents. Use Search Console and analytics together Search Console and analytics observe different objects. Search Console reports Google search clicks and impressions under its rules. Analytics records visits or events collected on the site. Differences can result from incomplete page loads, consent, blocking, time zones, URL grouping, filters, bots and session definitions. Use triangulation:Search Console for visibility, queries and clicks; analytics for landing pages and on-site actions; CRM for quality and revenue.Do not force equality. Add web performance without overload Current Core Web Vitals cover:LCP for loading; INP for responsiveness; CLS for visual stability.Leadership reporting can show the share meeting expectations, trend, critical pages, release impact and action. Use field data where available for real-user experience, with laboratory tests for diagnosis. A one-page example Web performance, June 2026 Summary Demo requests increased 18% on stable traffic. Two organic pages explain most of the growth. Sales-accepted leads remain below target, limiting the conclusion on quality. KPIsKPI Result vs May TargetQualified visits 18,240 +4% 18,000Demos 126 +18% 120Conversion rate 0.69% +0.08 pp 0.65%Accepted leads 61 +7% 70Collection availability 99.2% -0.8 pp 100%Three facts/analytics-guide/ generated 21 demos versus 10 in May. Paid search fell 14% after budget reduction. Direct rose on an email landing page, probably because links lacked UTM tags.DecisionsApply the guide-page pattern to two product pages. Fix the newsletter link generator. Review lead qualification with sales.Data quality A six-hour collection incident affected 12 June. The latest five days of CRM qualification are incomplete. The page can be read in two minutes. Appendices answer follow-up questions. Automate preparation, not judgement Automate extraction, variation calculations, tables, freshness controls, alerts, definition snapshots and draft generation. Keep human review for selecting important facts, validating anomalies, stating hypotheses, assigning confidence and deciding actions. Automation does not know why a campaign stopped, a form changed or a lead category has different value. A monthly calendar Day 1: data checks Verify freshness, incidents, definitions and imports. Day 2: analysis Identify movements, triangulate and prepare hypotheses. Day 3: operational review Marketing, product and sales confirm known changes. Day 4: publication Send the summary with actions. Mid-month: follow-up Check decisions before the next report. The exact schedule can be faster. Keep control, analysis and validation separate. Mistakes that make reporting useless Showing everything An exhaustive report prioritises nothing. Commenting only on growth Growth can remain below target or come from low-quality channels. Hiding incidents They will surface later and undermine the whole report. Claiming attribution without evidence “The campaign caused the increase” needs more than timing. Changing KPIs every month Continuity disappears. Change metrics when strategy changes and record the transition. Reporting team activity rather than outcomes “Ten articles published” is activity. Qualified entries and conversions from content are outcomes, still requiring cautious interpretation. Conclusion A useful monthly report has seven blocks:summary; KPIs; changes; explanations and confidence; actions; data quality; appendices.It keeps leadership informed without hiding complexity. It makes uncertainty visible, connects numbers to targets and assigns every conclusion to an action. Five well-defined indicators reviewed consistently beat fifty ownerless charts. FAQ How long should a monthly report be? The main summary can fit on one page. Appendices may be longer but should remain optional for leadership. PDF or dashboard link? Use a dated summary with access to detail. A short email or document plus dashboard link often works better than an exhaustive export. How many KPIs? Three to five primary KPIs are usually enough. Keep diagnostics in appendices. How should uncertain data be presented? State the limitation, possible cause and confidence. Do not replace missing data with a confident story. Previous month or previous year? Use previous month for operations and previous year for seasonality when scopes are comparable. Target variance is often the most useful comparison. SourcesGoogle Analytics, Reports overview Google Search Console, Performance report web.dev, Web Vitals Google Analytics, Landing page report Google Analytics, Traffic-source dimensions
- 08 Jun, 2026
Multi-site analytics dashboard: manage 5, 10 or 30 websites without losing clarity
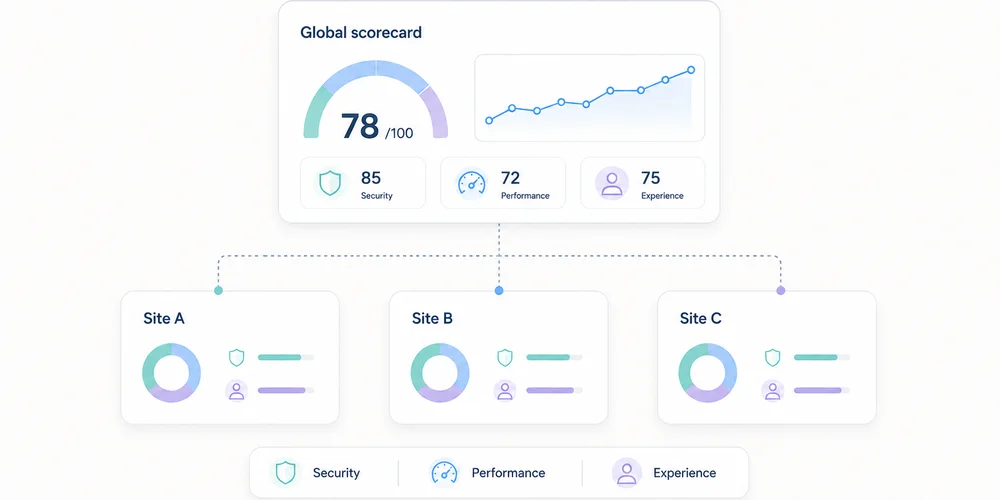
Tracking one website is a measurement problem. Tracking ten becomes a governance problem. Each team initially creates its own analytics property, event names and dashboard. Months later, the group has ten definitions of “conversion”, three time zones, incompatible campaign taxonomies and accounts with unclear ownership. The missing piece is not another chart. It is a shared structure. A useful multi-site dashboard must support two movements:compare properties on a consistent baseline; drill into each site without erasing its business context.Combining everything creates an abstract average. Separating everything hides the portfolio. The right architecture preserves both levels. Start with a property map List every site and its role before choosing metrics.Property Role Main audience Meaningful conversion OwnerCorporate site Trust Prospects, partners Qualified contact CommunicationsProduct A Acquisition SMBs Demo request Growth AProduct B Acquisition Mid-market Meeting booked Growth BHelp centre Support Customers Self-service resolution SupportBlog Discovery B2B audience Signup or product visit ContentSites with different purposes should not be ranked only by traffic. A help centre can perform well by reducing support demand even when it generates no demos. The map should also record:domains and subdomains; production environment; analytics tool and property ID; time zone; currency where relevant; creation date; business owner; technical owner; access list; collection mode; retention; active, migrating or archived status.This becomes the reference inventory. Define a common measurement contract The multi-site baseline is not a dashboard. It is a compact measurement contract applied to every property. Common dimensions Use shared definitions for:page or path; referrer domain; source, medium and campaign; country or region; device class; date and time zone; primary events; conversion status.Apply one URL parameter policy and one UTM taxonomy. Common events A small library is enough: form_submitted demo_requested signup_completed download_completed outbound_clicked search_usedEvery event needs a definition, trigger, allowed properties, owner, test and version. One name must not represent different actions. Conversely, three names for the same contact request prevent comparison. Common quality rules Document:test-environment filtering; bot handling; internal-domain handling; consent and collection modes; path normalisation; time zone; deployment process; alert thresholds.The data collection summary can hold the shared baseline and property-specific exceptions. Separate three reading levels A sound multi-site system does not put every chart on one page. Level 1: portfolio view This answers management questions:Which sites gain or lose useful traffic? Where are conversions moving? Which property has an anomaly? Which team needs investigation? Which site stopped sending data?Keep it short. A table with one row per property is often more useful than twenty small charts.Site Visits Change Useful conversions Rate Main channel Data statusCorporate 24,500 +6% 132 0.54% Organic OKProduct A 18,100 -4% 284 1.57% Paid search ReviewProduct B 9,600 +12% 96 1.00% Partners OKHelp 41,000 +2% n/a n/a Direct OKFigures are illustrative. Data status matters: a fall means something different when collection broke. Level 2: property view Each site retains its business dashboard:acquisition; landing pages; content; conversions; events; trends; data quality.A SaaS property may track trials, while a help centre tracks unsuccessful searches or support escalation. Level 3: diagnostics Analysts and engineers need:events by version; collection errors; unknown parameters; client/server discrepancies; time-series breaks; unexpected domains; test traffic; ingestion delay.Keep diagnostics out of executive reporting, but do not omit them. Otherwise every anomaly becomes a manual investigation. KPIs that can be compared Visits and page views They show scale but naturally favour larger sites. Always include trend and context. Common meaningful conversions A shared conversion group can include demo requests, qualified contacts, verified signups or confirmed purchases. Preserve the conversion mix too. A total can hide a shift toward lower-value actions. Conversion rate Rates compare different property sizes only when the denominator is identical. Document whether it uses visits, visitors, sessions or landing-page entries. Channel share Organic, paid, email, partner, referral and direct shares reveal dependence. This requires one campaign taxonomy. Collection health Add technical KPIs:time of last received event; event-volume change; rejected-event share; unknown parameters; pages missing path or title; abrupt direct-traffic movement.Data reliability is a governance KPI. What not to add naively Unique visitors The same person can visit several domains. Adding each site's unique visitors counts them more than once. A global identifier for deduplication materially changes collection. The CNIL notes that using the same identifier across several sites for global tracking falls outside the French consent-exemption conditions it describes for certain audience-measurement trackers. A lightweight report can instead use:visits by property; a clearly labelled non-deduplicated reach sum; or an aggregate method that does not require a person-level cross-site identifier.Heterogeneous conversions A brochure download is not automatically equal to a sale. Show a common total and its composition. Simple averages An average of ten conversion rates gives equal weight to a site with 100 visits and one with 100,000. Use a weighted overall rate or show the distribution. Unaligned periods Time zones and campaign calendars can move events between days or weeks. Normalise time before comparison. Compare without punishing small sites Multi-site views easily become rankings. That is rarely helpful. Use four axes:current level; change over time; local target; measurement confidence.A niche site can have low volume, healthy growth and high-value outcomes. A large site can hide paid-channel dependence or broken tracking. Trends and comparison bands are more useful than a podium. Structure access Multi-site operations increase excess-access risk. Define roles:portfolio owner: sees all properties and manages standards; site owner: administers one property; analyst: views and exports as needed; contributor: sees reports without changing collection; agency or partner: access limited to contracted properties; technical support: temporary, logged access when required.Avoid shared accounts. Review access quarterly, remove access at contract end and apply least privilege. Establish a governance cycle Weekly: monitor health Automate simple alerts for no data, abnormal shifts, unknown domains, rejected events and sudden direct-traffic changes. Monthly: discuss decisions Ask property owners:What changed? What action follows? Which hypothesis will be tested?Reporting should not become a reading of numbers. Quarterly: review the contract Check common events, UTM naming, inactive properties, access, retention, vendors, configuration differences and business goals. At launch: use a checklist Before adding a site:assign owners; set time zone; apply the collection baseline; configure filters; test events; verify consent behaviour; add it to the portfolio; document exceptions; create alerts; schedule the first review.Choose an architecture One property per site This is usually clearest for access, retention and configuration. It requires a portfolio layer for comparison. One shared property with a site dimension It can simplify some reports but mixes permissions, configurations and collection risks. One mistake affects the full dataset. One property per site plus a consolidated view This is often the best compromise: operational separation with portfolio aggregation. Some vendors provide roll-up or consolidated views. Verify plan requirements, deduplication method, permissions and exactly which data are combined. The key factor is not only the number of sites. It is their independence across teams, brands, purposes, regions, access and privacy settings. A one-page dashboard model Top stripportfolio visits; useful conversions; weighted overall rate; healthy property count; open anomaly count.Central table One row per property with trend, conversion, channel and status. Acquisition block Channel shares by site. Content block Top landing pages and rising pages, filterable by property. Quality block Missing data, rejected events, access reviews and recent deployments. Each block links to a detailed view. The portfolio dashboard signals; it does not explain everything. Conclusion Multi-site measurement works when governance comes before visualisation. You need:a clear property map; a common measurement contract; documented exceptions; three reading levels; comparable indicators; restricted access; a review cycle; consolidation that does not force person-level cross-site tracking.The best dashboard does not make every site identical. It gives them a shared language while preserving their role. FAQ Should every website have its own analytics property? It is often the clearest way to separate access and configuration. A consolidated view can compare them. A shared property can work when purposes and permissions are genuinely shared. Can unique visitors be added across sites? Not as deduplicated reach. One person can appear in several properties. Label the number as non-deduplicated or use an appropriate aggregate approach without introducing a global identifier by default. How many KPIs belong in the portfolio view? Five to eight well-defined columns are usually enough: volume, trend, conversion, rate, main channel and collection health. Details belong in property views. How should different site goals be handled? Keep a small common baseline and add local indicators. Compare each site with its own target and trend, not only with other sites. How often should access be reviewed? Quarterly review is a reasonable practice, with immediate removal when employees or vendors leave. SourcesCNIL, Audience-measurement cookies and consent conditions Google Analytics, Analytics account structure Google Analytics, Roll-up properties Matomo, Roll-Up Reporting Plausible, Consolidated view Regulation (EU) 2016/679, purpose limitation and data minimisation principles