Tag: Reporting
All blog posts with this tag.
- 07 Sep, 2026
Cyber Resilience Act: preparing incident reporting for software, scripts and SDKs
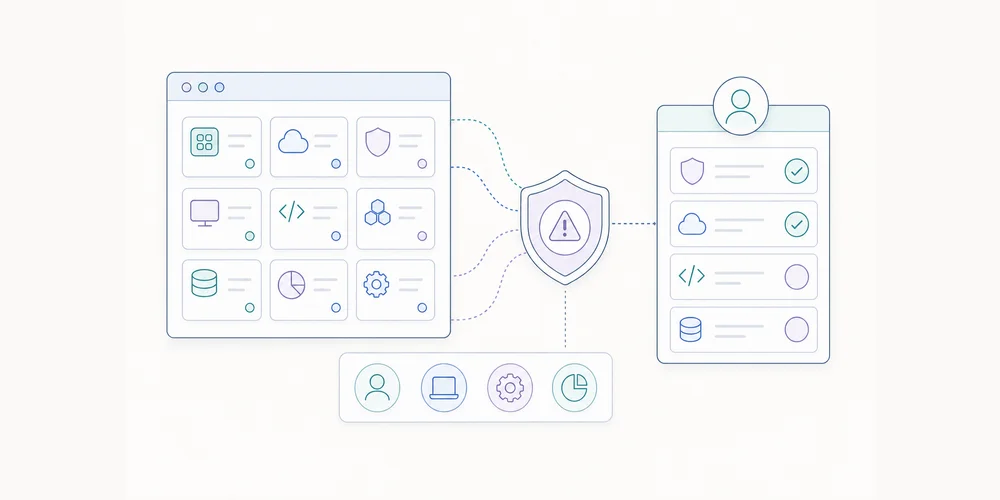
The Cyber Resilience Act is progressively becoming operational for software publishers. From 11 September 2026, manufacturers in scope will have to report actively exploited vulnerabilities and severe incidents that impact the security of products with digital elements. For a B2B SaaS company, analytics tool, JavaScript script, SDK or component distributed to customers, the topic should be analysed carefully. It would be wrong to assume that every SaaS service is automatically covered in the same way. It would also be risky to wait until December 2027 before organising incident response. This article is not a legal qualification. It gives product, security and engineering teams a practical preparation method when they distribute software or components used by customers. What changes on 11 September 2026 The European Commission states that, as of 11 September 2026, manufacturers must report certain events concerning products with digital elements: actively exploited vulnerabilities and severe incidents affecting product security. The timelines are short:early warning without undue delay and within 24 hours of becoming aware; vulnerability notification within 72 hours; final report within the applicable deadline, including 14 days after a corrective measure or mitigation becomes available for an actively exploited vulnerability, or within one month of the 72-hour notification for certain severe incidents.Notifications go through the CRA Single Reporting Platform, operated by ENISA, and are routed to the competent CSIRTs according to the applicable rules. The important point is that these reporting obligations arrive before the full application of the main product obligations under the Cyber Resilience Act. They should be prepared now, even if other parts of the regime come later. Why scripts and SDKs deserve attention Analytics teams often think first about the security of the main application: authentication, dashboard access, exports and databases. But the product surface can include other elements:a JavaScript script installed on customer sites; a client-side or server-side SDK; an open-source library maintained by the vendor; a connector or plugin; an API used to collect or expose data; an admin interface capable of changing injected code.These elements do not automatically have the same legal qualification. But they belong in the security inventory, because a vulnerability in a distributed component can affect multiple customers at once. For an analytics product, the collection script is especially sensitive. It runs on third-party websites, in visitors’ browsers, and may be updated centrally. A distribution flaw, compromised build or unauthorised modification could have a broader impact than a broken chart in a dashboard. Do not confuse a bug, a vulnerability and a severe incident Not every technical issue is a CRA report. A broken chart, a loading problem or an aggregation error is not necessarily an actively exploited vulnerability or a severe security incident. The first step in the runbook should therefore be qualification.Situation Question to askFunctional bug Does it affect product security or only user experience?Internally found flaw Is it exploitable, exposed, fixed or communicated?Actively exploited vulnerability Is there evidence of real exploitation?Security incident Does it have a severe impact on product security or users?Personal-data incident Does it also require separate GDPR breach assessment?The risk runs both ways. Under-reporting a truly serious issue exposes the organisation. Reporting every unqualified bug creates noise and weakens response discipline. The decision should be documented even when the conclusion is that no report is required. The minimal runbook to prepare A useful runbook must be concrete. It should not merely say “notify legal”. It should allow the team to act in the first hours. 1. Component inventory List products, scripts, SDKs, plugins and connectors distributed or made available to customers. For each one, document the internal owner, repositories, build pipeline, update mechanism, exposed customers, critical dependencies and communication channels. 2. Qualification criteria Define a simple grid: whether security is affected, whether exploitation is observed, potential impact, customer scope, corrective measure availability, technical evidence and possible parallel obligations. 3. Decision team Identify who can qualify the event: engineering, security, product, leadership, legal and the DPO when personal data is involved. Backups should be known. Weekends and holidays should be covered. 4. Timestamping The deadline starts when the organisation becomes aware. The team must record when it had enough information to suspect or qualify the event. A ticket without a reliable timestamp will make compliance harder to demonstrate. 5. Evidence and logging Preserve logs, versions, build hashes, deployed artefacts, exploitation traces, customer messages, internal alerts and qualification decisions. The evidence should be sufficient to reconstruct the timeline. 6. Reporting channel The Single Reporting Platform is operated by ENISA. Teams should know who has the necessary access, which information is needed and what to do if the primary access path is unavailable. ENISA has indicated that there is no API planned at this stage, which makes human procedures even more important. 7. Customer communication Regulatory reporting does not replace customer communication. Prepare concise templates: what is known, what remains uncertain, what customers should do and when the next update will come. Analytics and third-party scripts An analytics script should be treated as a sensitive asset, even when it collects limited data. It may be embedded in public pages, conversion funnels or authenticated environments. The security of the script therefore matters not only to the vendor but also to the sites that install it. Concrete controls include:separation of rights between application code, build pipeline and script publication; dependency review; signing or integrity controls for artefacts where relevant; detection of unexpected changes; fast rollback capability; mitigation or disabling procedure; documentation of versions deployed to customers.These practices are useful beyond the CRA. They reduce operational risk and make crisis communication more reliable. What to decide now Teams that wait for the first incident to organise their response will lose time in the first 24 hours. Those are exactly the most constrained hours. By the end of September, a software team should be able to answer four questions:Which customer-distributed components could be in scope? Who qualifies an actively exploited vulnerability? Who can submit a notification within the deadline? How can the decision timeline be proven?If these answers do not exist, the topic is not yet under control. Conclusion The Cyber Resilience Act should not be reduced to a distant 2027 deadline. Reporting obligations applying from 11 September 2026 already require manufacturers in scope to prepare. For SaaS and analytics vendors, the priority is not to panic or to assume everything is automatically covered. The priority is to inventory components, qualify roles, prepare the runbook and document decisions. A good reporting process is not only a regulatory response. It is evidence of product maturity. FAQ Does the CRA apply to every SaaS dashboard? Not automatically. The qualification depends on the product, the role of the organisation and the way software components are placed on the market or provided. The article is a preparation checklist, not a legal classification of every SaaS case. Should every security bug be reported through the CRA process? No. The reporting duty discussed here concerns actively exploited vulnerabilities and severe incidents with a security impact, according to the CRA framework. Ordinary bugs still need internal handling, but they should not be confused with regulatory reporting triggers. Why should analytics teams care? Analytics stacks often include scripts, SDKs, API keys, client-side configuration and third-party dependencies. Even when the legal obligation falls elsewhere, teams need clear incident routing and supplier contacts. SourcesEuropean Commission - Cyber Resilience Act reporting obligations European Commission - Cyber Resilience Act summary ENISA - CRA Single Reporting Platform FAQ
Search Console and generative AI: how to read the new reports without overinterpreting impressions
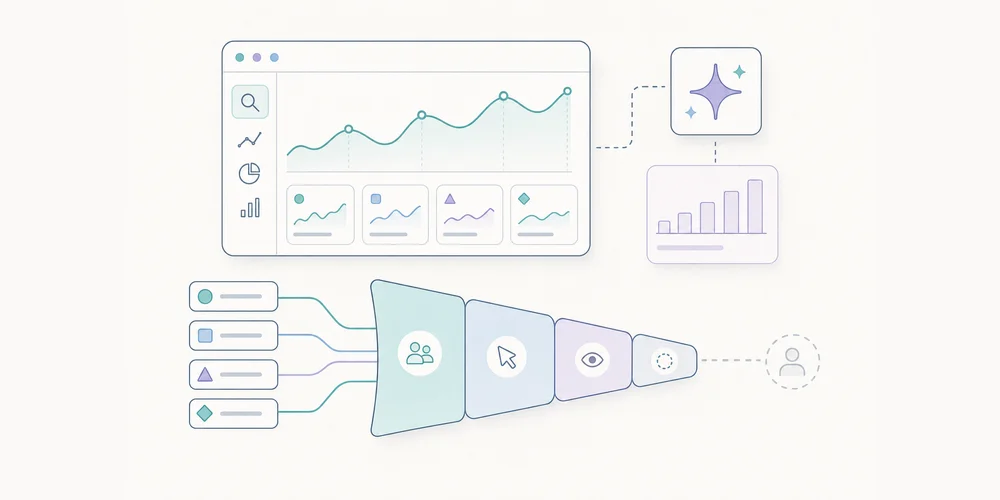
Google Search Console is becoming more useful for understanding visibility in generative search experiences. In June 2026, Google announced new reports dedicated to how pages appear in generative AI features in Search, such as AI Overviews and AI Mode, as well as some generative AI features in Discover. For SEO teams, this matters. It does not, however, turn Search Console into an attribution tool. An impression in a generative feature does not mean that someone visited your site, read your content, or identified you as the main source. It is a visibility signal. It becomes useful when it is interpreted carefully, compared with actual clicks, and connected to sessions measured on your site. The goal is not to create a new vanity metric. The goal is to understand what this visibility means, what it does not mean, and how to include it in SEO and analytics reporting without blurring the measurement layers. What changed in Search Console On 3 June 2026, Google announced new Search Console performance reports dedicated to generative AI. The reports are designed to help site owners understand how their pages appear in Google Search generative AI features. Google also states that this data remains included in the overall performance reports, while the new view isolates generative visibility. Google rolled the reports out worldwide on 31 August 2026. Their absence should therefore be investigated as an access, configuration or reporting issue rather than treated as the normal initial rollout state. The reports can show:impressions for URLs appearing in generative AI features; the pages involved; countries; devices, where available for Search; dates, with several time granularities; Search Console dates use Pacific Time.These fields are useful, but they do not replace classic Search Console or analytics metrics. They add a layer: visibility inside an interface where the answer is often summarised before a click happens. AI impression, click and session are different signals A frequent mistake is to merge three separate levels of measurement. An AI impression means that one of your URLs appeared in a generative feature according to Google’s reporting methodology. It is a signal of presence in the search interface. A click means that a user selected a link to your site. It is a potential transition from Google to your site. An analytics session means that a visit was observed on your site by your analytics tool, according to its own collection, filtering and deduplication rules. These signals can move differently. A page can gain impressions in AI Overviews without gaining clicks. A page can receive more clicks from Google while analytics sessions do not increase as expected because referrers, redirects, parameters or filters distort the view. Conversely, a drop in sessions does not automatically mean a drop in search visibility. The useful approach is to keep the three levels separate, then reconcile them only when there is a clear diagnostic question. How Google counts AI Mode and AI Overviews Search Console documentation reminds site owners that counting rules vary by feature. For AI Mode, clicks, impressions and position are recorded using the usual Search Console methodology. If a user asks a follow-up question in AI Mode, that follow-up is counted as a new query. For AI Overviews, standard Search Console impression rules apply. The visibility-after-scrolling or expansion rule applies only to the independent widgets for which Google documents it. Links in the same AI Overview may also share the same position in reporting. These details matter. They explain why average position should not be read like a classic organic ranking. Appearing in a generative block is not the same format as a blue link, a carousel, a featured snippet or a local result. What not to conclude too quickly The first trap is to call every generative impression “AI traffic”. Until there is a click, it is not traffic to your site. It is visibility in a search interface. The second trap is to compare generative impressions and classic web impressions as if they belonged to the same inventory. The spaces are different, the displays are different, and user journeys do not create the same click-through behaviour. The third trap is to isolate a single indicator. More impressions can be good if they involve strategic pages. They are less useful if they relate to low-intent queries, irrelevant countries or pages that do not support the business. The fourth trap is to ignore measurement incidents. Search Console has a data anomalies page. It should be checked before attributing a curve break to an SEO or product change. A simple method for reading the report Start with a reference period. Avoid drawing conclusions from one isolated week, especially if the report has just appeared or volumes are low. A four-to-eight-week window is more useful when enough data is available. Then separate pages into three groups:acquisition pages, such as articles, comparisons and guides; conversion pages, such as product, pricing or demo pages; support or brand pages, which often respond to already-qualified queries.For each group, compare generative impressions, Search Console clicks and organic sessions measured on your site. The diagnostic is useful only if you can state a clear hypothesis. Examples:AI impressions increase, but clicks stay flat: your content is visible in the answer, but not necessarily driving site visits; clicks increase, but sessions do not: check referrers, redirects, parameters and analytics filters; impressions drop on a few pages only: check queries, country, device and content changes; all impressions drop suddenly: check Search Console anomalies first, then investigate SEO hypotheses.How to report it monthly In a monthly report for leadership or marketing teams, avoid a single line called “Google AI traffic”. It mixes too many realities. A clearer structure is:Google generative visibility: Search Console impressions in AI features, when available. Google organic traffic: Search Console clicks and analytics sessions. Traffic from external assistants or conversational engines: sessions with identifiable source or referrer, when your analytics tool observes them. Useful actions: demo requests, signups, email clicks, downloads or key events.This separation reduces overinterpretation. It also helps explain why a brand may be displayed more often without necessarily receiving more visits. Useful content actions Generative reports do not rewrite SEO fundamentals. Google states that SEO best practices remain relevant for appearing in generative AI features. Helpful, original, precise and non-commodity content remains more defensible than pages written only to fill a query pattern. In practice, teams can:strengthen pages that answer a real business question; document sources and update dates; clarify definitions, limits and use cases; avoid generic paragraphs that could be replaced by any competitor; connect Search Console to web analytics without merging the metrics.For a privacy-first analytics team, the key is readability. Measuring visibility in AI interfaces is useful only if it supports a decision: improving a page, correcting a diagnostic, adapting a report, or explaining why sessions do not grow at the same pace as impressions. Checklist before making a claim Before announcing a rise or drop linked to generative AI, check:that the report is available for the site; that the period is long enough; that the pages are strategically relevant; that impressions, clicks and sessions are separated; that countries and devices match the target market; that no known data anomaly explains the variation; that analytics attributes organic sessions correctly; that variations are put in context with content changes, seasonality and demand.Conclusion The new Search Console reports for generative AI are useful. They provide a clearer view into a part of Google Search that was previously difficult to isolate. But they should not be treated as automatic proof of traffic, authority or conversion. The right reading is to treat them as a visibility signal, then carefully connect them to clicks and sessions. As search becomes more fragmented, teams need less slogan-driven reporting and more contextual measurement. FAQ Does the Search Console AI report measure visits? No. It primarily reports search performance signals such as impressions and clicks. A visit should be confirmed in analytics when a user actually lands on the site. Does a drop in AI impressions mean SEO visibility declined? Not always. A change may come from real visibility, interface changes or a logging issue. The August 2026 anomaly is a reminder to check official notes before making a claim. Should AI visibility have a separate monthly report? At first, it is usually better to add a dedicated section to the existing SEO report. A separate report only makes sense when the volume and decisions attached to the signal become material. SourcesGoogle Search Central - Introducing Search Generative AI performance reports in Search Console Google Search Central - What are impressions, position, and clicks? Google Search Central - A new resource for optimizing for generative AI in Google Search Google Search Central - Data anomalies in Search Console
- 08 Jun, 2026
Multi-site analytics dashboard: manage 5, 10 or 30 websites without losing clarity
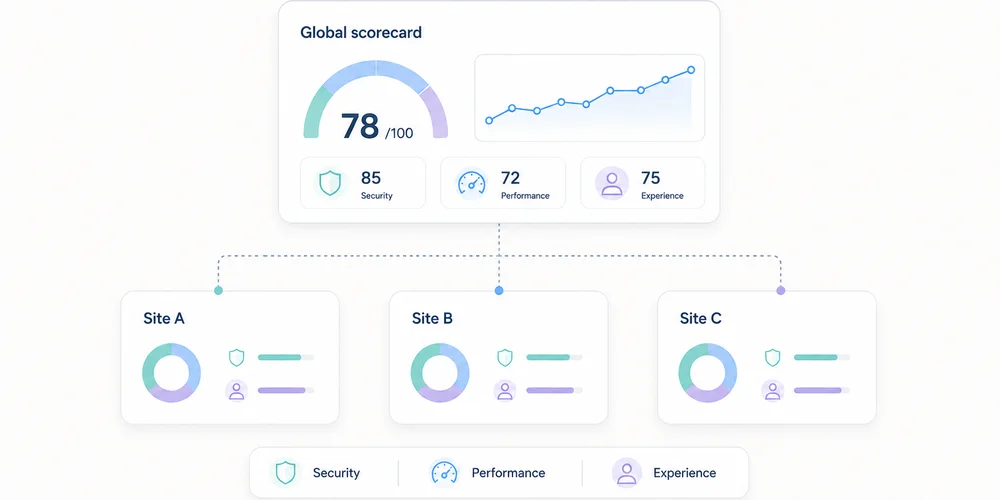
Tracking one website is a measurement problem. Tracking ten becomes a governance problem. Each team initially creates its own analytics property, event names and dashboard. Months later, the group has ten definitions of “conversion”, three time zones, incompatible campaign taxonomies and accounts with unclear ownership. The missing piece is not another chart. It is a shared structure. A useful multi-site dashboard must support two movements:compare properties on a consistent baseline; drill into each site without erasing its business context.Combining everything creates an abstract average. Separating everything hides the portfolio. The right architecture preserves both levels. Start with a property map List every site and its role before choosing metrics.Property Role Main audience Meaningful conversion OwnerCorporate site Trust Prospects, partners Qualified contact CommunicationsProduct A Acquisition SMBs Demo request Growth AProduct B Acquisition Mid-market Meeting booked Growth BHelp centre Support Customers Self-service resolution SupportBlog Discovery B2B audience Signup or product visit ContentSites with different purposes should not be ranked only by traffic. A help centre can perform well by reducing support demand even when it generates no demos. The map should also record:domains and subdomains; production environment; analytics tool and property ID; time zone; currency where relevant; creation date; business owner; technical owner; access list; collection mode; retention; active, migrating or archived status.This becomes the reference inventory. Define a common measurement contract The multi-site baseline is not a dashboard. It is a compact measurement contract applied to every property. Common dimensions Use shared definitions for:page or path; referrer domain; source, medium and campaign; country or region; device class; date and time zone; primary events; conversion status.Apply one URL parameter policy and one UTM taxonomy. Common events A small library is enough: form_submitted demo_requested signup_completed download_completed outbound_clicked search_usedEvery event needs a definition, trigger, allowed properties, owner, test and version. One name must not represent different actions. Conversely, three names for the same contact request prevent comparison. Common quality rules Document:test-environment filtering; bot handling; internal-domain handling; consent and collection modes; path normalisation; time zone; deployment process; alert thresholds.The data collection summary can hold the shared baseline and property-specific exceptions. Separate three reading levels A sound multi-site system does not put every chart on one page. Level 1: portfolio view This answers management questions:Which sites gain or lose useful traffic? Where are conversions moving? Which property has an anomaly? Which team needs investigation? Which site stopped sending data?Keep it short. A table with one row per property is often more useful than twenty small charts.Site Visits Change Useful conversions Rate Main channel Data statusCorporate 24,500 +6% 132 0.54% Organic OKProduct A 18,100 -4% 284 1.57% Paid search ReviewProduct B 9,600 +12% 96 1.00% Partners OKHelp 41,000 +2% n/a n/a Direct OKFigures are illustrative. Data status matters: a fall means something different when collection broke. Level 2: property view Each site retains its business dashboard:acquisition; landing pages; content; conversions; events; trends; data quality.A SaaS property may track trials, while a help centre tracks unsuccessful searches or support escalation. Level 3: diagnostics Analysts and engineers need:events by version; collection errors; unknown parameters; client/server discrepancies; time-series breaks; unexpected domains; test traffic; ingestion delay.Keep diagnostics out of executive reporting, but do not omit them. Otherwise every anomaly becomes a manual investigation. KPIs that can be compared Visits and page views They show scale but naturally favour larger sites. Always include trend and context. Common meaningful conversions A shared conversion group can include demo requests, qualified contacts, verified signups or confirmed purchases. Preserve the conversion mix too. A total can hide a shift toward lower-value actions. Conversion rate Rates compare different property sizes only when the denominator is identical. Document whether it uses visits, visitors, sessions or landing-page entries. Channel share Organic, paid, email, partner, referral and direct shares reveal dependence. This requires one campaign taxonomy. Collection health Add technical KPIs:time of last received event; event-volume change; rejected-event share; unknown parameters; pages missing path or title; abrupt direct-traffic movement.Data reliability is a governance KPI. What not to add naively Unique visitors The same person can visit several domains. Adding each site's unique visitors counts them more than once. A global identifier for deduplication materially changes collection. The CNIL notes that using the same identifier across several sites for global tracking falls outside the French consent-exemption conditions it describes for certain audience-measurement trackers. A lightweight report can instead use:visits by property; a clearly labelled non-deduplicated reach sum; or an aggregate method that does not require a person-level cross-site identifier.Heterogeneous conversions A brochure download is not automatically equal to a sale. Show a common total and its composition. Simple averages An average of ten conversion rates gives equal weight to a site with 100 visits and one with 100,000. Use a weighted overall rate or show the distribution. Unaligned periods Time zones and campaign calendars can move events between days or weeks. Normalise time before comparison. Compare without punishing small sites Multi-site views easily become rankings. That is rarely helpful. Use four axes:current level; change over time; local target; measurement confidence.A niche site can have low volume, healthy growth and high-value outcomes. A large site can hide paid-channel dependence or broken tracking. Trends and comparison bands are more useful than a podium. Structure access Multi-site operations increase excess-access risk. Define roles:portfolio owner: sees all properties and manages standards; site owner: administers one property; analyst: views and exports as needed; contributor: sees reports without changing collection; agency or partner: access limited to contracted properties; technical support: temporary, logged access when required.Avoid shared accounts. Review access quarterly, remove access at contract end and apply least privilege. Establish a governance cycle Weekly: monitor health Automate simple alerts for no data, abnormal shifts, unknown domains, rejected events and sudden direct-traffic changes. Monthly: discuss decisions Ask property owners:What changed? What action follows? Which hypothesis will be tested?Reporting should not become a reading of numbers. Quarterly: review the contract Check common events, UTM naming, inactive properties, access, retention, vendors, configuration differences and business goals. At launch: use a checklist Before adding a site:assign owners; set time zone; apply the collection baseline; configure filters; test events; verify consent behaviour; add it to the portfolio; document exceptions; create alerts; schedule the first review.Choose an architecture One property per site This is usually clearest for access, retention and configuration. It requires a portfolio layer for comparison. One shared property with a site dimension It can simplify some reports but mixes permissions, configurations and collection risks. One mistake affects the full dataset. One property per site plus a consolidated view This is often the best compromise: operational separation with portfolio aggregation. Some vendors provide roll-up or consolidated views. Verify plan requirements, deduplication method, permissions and exactly which data are combined. The key factor is not only the number of sites. It is their independence across teams, brands, purposes, regions, access and privacy settings. A one-page dashboard model Top stripportfolio visits; useful conversions; weighted overall rate; healthy property count; open anomaly count.Central table One row per property with trend, conversion, channel and status. Acquisition block Channel shares by site. Content block Top landing pages and rising pages, filterable by property. Quality block Missing data, rejected events, access reviews and recent deployments. Each block links to a detailed view. The portfolio dashboard signals; it does not explain everything. Conclusion Multi-site measurement works when governance comes before visualisation. You need:a clear property map; a common measurement contract; documented exceptions; three reading levels; comparable indicators; restricted access; a review cycle; consolidation that does not force person-level cross-site tracking.The best dashboard does not make every site identical. It gives them a shared language while preserving their role. FAQ Should every website have its own analytics property? It is often the clearest way to separate access and configuration. A consolidated view can compare them. A shared property can work when purposes and permissions are genuinely shared. Can unique visitors be added across sites? Not as deduplicated reach. One person can appear in several properties. Label the number as non-deduplicated or use an appropriate aggregate approach without introducing a global identifier by default. How many KPIs belong in the portfolio view? Five to eight well-defined columns are usually enough: volume, trend, conversion, rate, main channel and collection health. Details belong in property views. How should different site goals be handled? Keep a small common baseline and add local indicators. Compare each site with its own target and trend, not only with other sites. How often should access be reviewed? Quarterly review is a reasonable practice, with immediate removal when employees or vendors leave. SourcesCNIL, Audience-measurement cookies and consent conditions Google Analytics, Analytics account structure Google Analytics, Roll-up properties Matomo, Roll-Up Reporting Plausible, Consolidated view Regulation (EU) 2016/679, purpose limitation and data minimisation principles
- 06 Apr, 2026
Why your Search Console impressions may drop in April 2026 without your SEO getting worse
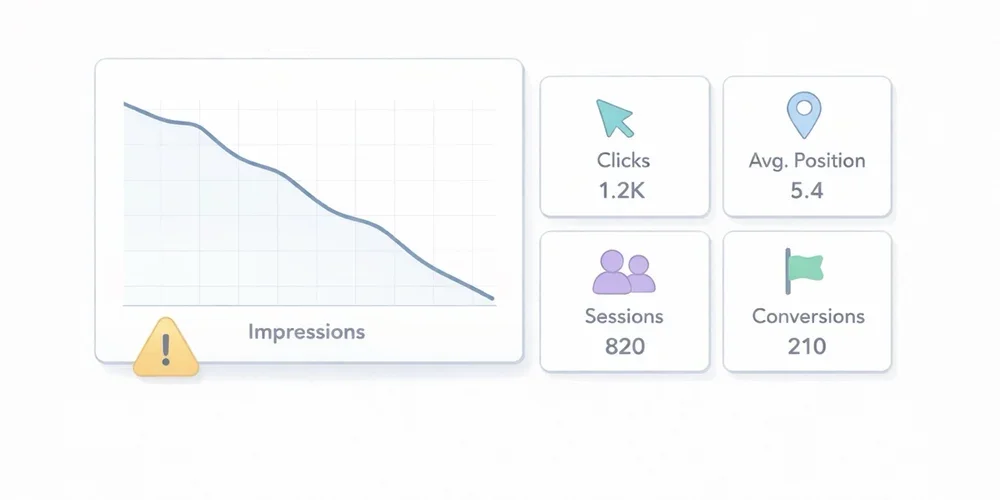
In April 2026, Google added and then updated an official note on the Search Console data anomalies page. The message is simple, but its consequences can create a lot of false alarms in SEO dashboards: a logging issue prevented Search Console from accurately reporting impressions from May 13, 2025 until April 27, 2026. Google now says the issue has been resolved. In practice, many teams will see impressions drop in Search Console without seeing an equivalent drop in real-world search visibility. And because the interface also shows average CTR and average position, correcting impression counts can move several metrics at once even when actual SEO performance has not materially changed. For a small or midsize business, a marketing team, or an agency, this is exactly the kind of moment when bad diagnosis becomes expensive. You think you are seeing a ranking problem, you trigger an emergency review, you rewrite pages that were fine, and only later realize the original signal was partly a measurement artifact. This article has a simple goal: explain what Google actually announced, clarify which metrics deserve more trust after this correction, and give you a more resilient way to read your SEO data. What Google actually said The note Google published on April 3, 2026 highlights four important points. First, this is a logging issue in Search Console. Google is not saying that a ranking change or search delivery issue affected the live search results. It is saying that impression reporting inside the tool was not being recorded accurately. Second, Google dates the start of the issue to May 13, 2025. That matters because it means recent historical reporting for many properties may have been affected for almost a year. Third, Google now says the issue has been resolved. The operational reading is therefore to compare periods before and after April 27, 2026 carefully, rather than looking for an immediate SEO cause behind every impression break. Fourth, Google states that only impressions and related metrics, such as CTR and average position, were affected. Clicks were not affected by the error. This is probably the most useful operational takeaway. If clicks remain the most reliable signal, then the correct response to falling impressions is not panic. It is a change in analytical priorities. Why lower impressions do not automatically mean worse SEO In Search Console, an impression reflects that your property was shown in Google Search according to the tool’s reporting rules. The Performance report also includes clicks, average CTR, and average position. The key point is this: if impressions were overstated or logged incorrectly and are now being corrected, a visible drop in the chart may simply reflect a return to more accurate measurement. It does not automatically mean your pages are being shown less often in Google Search. That is especially true if, at the same time:clicks remain stable; average position shows no break confirmed by clicks; organic Google traffic in your analytics tool does not break down; SEO-driven conversions do not show a clear structural drop.In other words, you need to separate measurement correction from performance deterioration. That distinction matters because many teams have learned to treat impressions as a universal leading indicator. In this case, Google explicitly says the issue affected impression logging, not clicks. If your reporting logic is built around impressions without context, you can easily mistake a reporting fix for an SEO problem. The average CTR trap Average CTR deserves extra caution. In Search Console, CTR is calculated from clicks and impressions. If Google corrects impressions downward while clicks remain unchanged, CTR can rise mechanically. That means a higher CTR will not necessarily signal better snippets, stronger intent alignment, or better SEO execution. It may simply reflect the corrected denominator. This is where automated dashboards can tell a very persuasive but very false story:impressions are down; CTR is up; therefore traffic must be more qualified.That conclusion may be completely wrong. Around the resolution period, CTR should be treated as a derived metric that needs context, not as immediate proof of improvement or decline. Which metrics to trust first When one metric becomes unstable, the right move is to anchor analysis in the most robust signals. In this situation, here is the reading order I recommend. 1. Search Console clicks Because Google says clicks were not affected, they become the primary anchor. Review them at several levels:whole property; strategic directories; key pages; comparable groups of pages.You are not looking for one odd day. You are looking for a real break in trend. 2. Average position, with nuance Google says average position is one of the impression-related metrics that was affected. Do not treat it as a perfectly stable independent signal. It is still useful context, but it should be read alongside clicks, pages, and queries. Operationally, use it to answer a simple question: are you seeing a real decline confirmed by clicks and critical pages, or only an impression change tied to the reporting correction? 3. Google organic traffic in your analytics tool Search Console measures what happens before the click in Google Search. Your analytics tool measures what happens after the visit reaches your site. Those are different views, which is exactly why they are complementary. If Search Console shows lower impressions while your Google organic traffic remains stable in analytics, that is a strong argument against the idea of a real SEO drop. For most marketing teams, this is the most useful cross-check. A reporting correction upstream does not necessarily create any business impact downstream. 4. Organic conversions For many businesses, this is the real red line. If forms, trials, demo requests, downloads, or revenue attributed to organic search remain stable, you should avoid overreacting to a single impression series. Conversely, if clicks, organic traffic, and conversions all decline together, you probably do have a real issue worth investigating. The right way to read after the resolution Here is a simple process that is strong enough for an SMB or an agency. Step 1: freeze fast conclusions about impressions Around the corrected period, avoid statements like:“Our visibility is collapsing” “Google is showing us less” “The content we published in January is underperforming” “The redesign broke SEO”Those conclusions may turn out to be true, but impressions alone are no longer enough to support them cleanly. Step 2: extend comparison windows A 7-day versus 7-day comparison becomes more fragile when a metric has just been corrected. Prefer:28 days versus 28 days; rolling 8-week views; calendar months if your volume supports it.The goal is to reduce noise and avoid reacting to a purely technical movement. Step 3: segment before you interpret Review separate views for:business-critical pages; blog content; documentation; branded versus non-branded traffic; important countries or devices if volume is large enough.A broad measurement issue does not always appear identically across every segment. And a real SEO issue often leaves a more localized signature. Step 4: reconcile Search Console and analytics Build a simple cross-check:Search Console clicks Google organic sessions Organic conversions Average position on critical page setsIf the four lines tell the same story, you can act with confidence. If only the impression line diverges, caution is warranted. Step 5: document the anomaly in reports If you work with teammates or clients, add a note to dashboards and monthly reports. One sentence is enough:In April 2026, Google reported a logging issue affecting Search Console impressions from May 13, 2025 until April 27, 2026. According to Google, only impressions and related metrics such as CTR and average position were affected; clicks were not. Impression changes around this period should be interpreted carefully.This small note can prevent a surprising amount of confusion. What not to do When data moves, the classic mistake is to act too fast. These are the reflexes to avoid. Do not rewrite titles and meta descriptions at scale after the first drop in impressions Yes, snippets can influence CTR. But in the current context, if the drop comes from a reporting correction, you may be changing pages that were never the problem. Do not launch an emergency technical audit without converging evidence A technical audit makes sense if several signals deteriorate together, or if you also see indexing, coverage, crawl, or site quality issues. An isolated impression drop is not enough. Do not over-interpret short-term winners and losers During a correction period, weekly top gainers and losers can become misleading. A page that “lost” impressions may not have lost actual search visibility. Do not confuse reporting trend with business trend This is probably the most important point. To manage a website, you need to separate:a metric that describes potential exposure; a metric that describes actual visits; a metric that describes useful action.Impressions matter, but they do not fill a sales pipeline on their own. What this news reminds us about SEO measurement This story is useful beyond the Google announcement itself. It highlights three broader principles. 1. No reporting tool is raw reality Search Console is extremely valuable, but it is still a reporting system with its own rules, aggregations, limits, and occasional anomalies. Numbers always need context. 2. Good reporting should survive an anomaly in a single tool If your whole SEO diagnosis depends on one impression chart, your reading is too fragile. A resilient setup should at least cross-check visibility, traffic, and business outcomes. 3. Teams should favor metrics that support decisions This is simple but often forgotten: out of all the available metrics, which ones actually help you decide what to do next? In this case, clicks, organic sessions, and conversions are often more decision-useful than raw impressions. What I recommend to teams, agencies, and SMBs right now Here is the short version. After this resolution, keep using Search Console, but do not treat impressions as the only alert metric for the affected periods. Move clicks to the top of the stack, keep average position as context, and always validate the diagnosis with analytics and conversions. For an SMB, the best posture is not to ignore Search Console. It is to put Search Console back in its proper place inside a simpler measurement system. Search Console tells you how Google exposes your pages. Your analytics tool tells you what visitors actually do after the click. Both matter, but they do not answer the same question. If you want a more stable acquisition view, this is also a good moment to review your SEO dashboards and limit executive reporting to the metrics that clearly support decisions. For a broader take on choosing a readable analytics setup, you can also read our guide: Google Analytics, Matomo or privacy-first analytics? The complete guide for 2026. Conclusion The impression drop many sites will notice in April 2026 should not be read automatically as an SEO decline. Google itself reported a logging issue affecting Search Console impressions from May 13, 2025 until April 27, 2026, now marked as resolved. In that context, the right response is not panic. It is a more disciplined reading model:clicks first; average position as context; organic traffic and conversions to validate real impact.In SEO, as in analytics, the biggest risk is not always poor performance. Sometimes it is poor diagnosis. FAQ Why are my Search Console impressions suddenly dropping in April 2026? Because Google reported in April 2026 that a logging issue had affected impression reporting from May 13, 2025 until April 27, 2026. Its resolution can produce a visible drop in impressions without reflecting a real SEO decline. Are Search Console clicks reliable during this correction? According to Google, yes. The official note says clicks were not affected by the error. That makes clicks the most useful metric to prioritize during this period. My CTR is increasing while impressions are falling. Is that good news? Not necessarily. Because CTR is calculated from clicks and impressions, a lower impression count with stable clicks can increase CTR mechanically. That is not automatic evidence of improvement. Should I change my SEO pages right away? Not based on impressions alone. Before making changes, also review clicks, average position, organic traffic in your analytics tool, and SEO-driven conversions. What is the best way to track real business impact? Cross-check Search Console with your analytics setup. If clicks, Google organic sessions, and conversions remain stable, you are more likely looking at a reporting correction than a real SEO problem. Sources Sources checked on May 10, 2026.Google Search Console Help, Data anomalies in Search Console Google Search Console Help, What are impressions, position, and clicks? Google Search Console Help, Performance report (Search results) Google Search Central, Using Search Console and Google Analytics Data for SEO