Tag: Ga4
All blog posts with this tag.
- 27 Jul, 2026
Analytics migration: a checklist for changing tools without rebuilding tracking debt
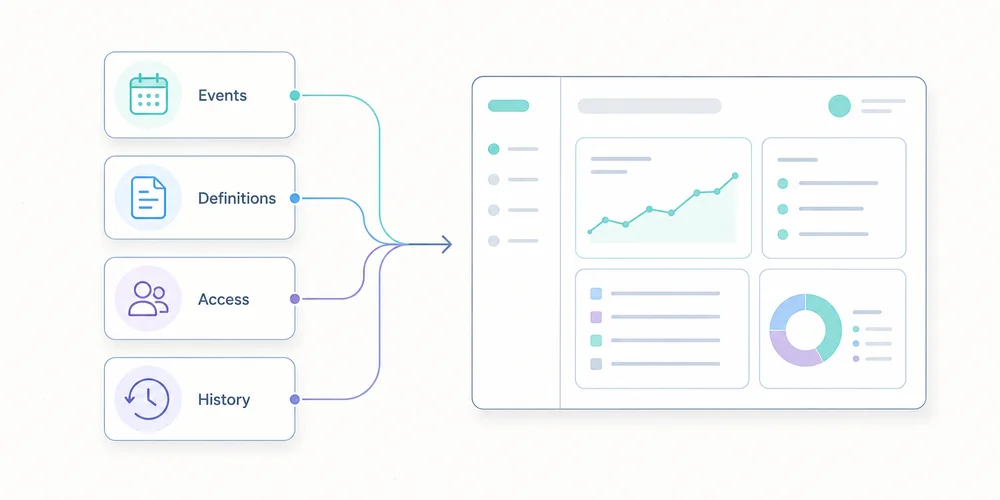
Changing analytics tools can look simple: replace a script, wait a few days and compare the charts. That is rarely enough. A migration changes several layers at once:collected data; metric definitions; consent behaviour; events and conversions; website and workspace structure; access; retention; reports; decision-making habits.The main risk is not losing a chart. It is carrying old tracking debt into a new tool, then reading a methodological change as a business change. This checklist offers a twelve-step migration process for SMEs, B2B SaaS companies and multi-site teams. 1. Define why the migration is happening Write down the reason for the change. Examples include:reducing collection complexity; documenting data more clearly; improving readability across teams; reducing cost; controlling hosting or retention; simplifying consent governance; managing several sites consistently; replacing a discontinued or unsuitable tool.Turn the reason into acceptance criteria.Objective Verifiable criterionSimplify The monthly report uses five stable indicatorsReduce collection Every collected field has a documented purposeGovern multiple sites Access and naming are consistentControl cost Total cost is known for expected volumeClarify consent The actual configuration is documented and testedImprove quality Critical events pass an acceptance testWithout criteria, the project ends when the script runs. With criteria, it ends when the team can make decisions confidently again. Use the analytics governance scorecard to formalise this stage. 2. Inventory the current system before removing anything Create a technical and editorial inventory. Scripts and collection points List:scripts loaded by the site; tag-manager tags; advertising pixels; server-side collection; CMS plugins; mobile SDKs; backend events; CRM, support, payment and email integrations; consent settings; proxies and collection domains.Data and reports List:pageviews; events; conversions; custom dimensions; audiences; segments; funnels; recurring reports; exports; alerts; dashboards; API consumers; report recipients.Responsibilities For each component, record:owner; purpose; destination; collection condition to review; retention; access; dependencies; decision: keep, transform or remove.This inventory becomes the basis of the analytics data collection summary. It often reveals tags that nobody uses. 3. Freeze definitions before rebuilding Two tools may use the same words for different metrics. Visitor, user, session, engagement, bounce, conversion and source can depend on:time windows; identification methods; session rules; filters; consent; bot processing; time zones; attribution; received events.Create a migration dictionary:Business concept Previous definition New definition DecisionVisit Current session rule New tool's rule Compare trendsLead Form event Accepted submission StandardiseSource Calculated channel Referrer/UTM Document gapConversion Historical list Priority goals ReduceInternal traffic IP filter New rule RetestDo not force false equivalence. A documented break in the series is safer than artificially aligned numbers. 4. Reduce the tracking plan A migration is an opportunity to remove, not only copy. Classify existing events into four groups:decision events, required for a KPI or action; diagnostic events, useful for explaining a problem; operational events, required by an integration; orphan events, collected without an identifiable use.Remove orphans. Consolidate variants that describe the same action. Choose stable names and a clear property set. A critical event should specify:name; trigger; page or context; permitted parameters; example; owner; related KPI; success test.A minimal analytics tracking plan provides a practical baseline. 5. Inspect collection and URLs Before installing the new tool, review what it will actually receive. URLs can contain:UTM parameters; campaign IDs; internal search terms; email addresses; tokens; order references; customer IDs; form values; technical fragments.Define an allowlist or removal strategy. Keep acquisition parameters where necessary, but remove sensitive or purely technical values before storage. The guide to privacy-first URL parameter filtering explains this control. Also inspect:referrer; IP handling; headers; user agent; event properties; server-side payloads; infrastructure logs; exports.Cookieless describes only one part of collection. The migration must document the full signal set. 6. Review consent, contracts and governance Changing tools does not automatically make a configuration exempt from consent. Review:purposes; trackers or terminal access; collected data; enrichment; third-party disclosure; provider reuse; transfers outside the EEA; subprocessors; retention; objection mechanisms where relevant; user information; consent-manager configuration.The CNIL describes strict conditions for limited audience-measurement configurations. It also states that a solution should not be presented as officially certified or approved by the authority. Update:the processing register; privacy notice; tracker inventory; data-processing agreement; access and deletion procedures; internal documentation.The assessment follows the real configuration, not the provider name alone. 7. Build a pilot environment Avoid replacing every site at once. Choose:a representative site; one acquisition page; one form; a few critical events; enough traffic to observe behaviour; a period without a major redesign.Install the new tool as a pilot. A short, controlled parallel-measurement period may be useful, but two active systems can mean two scripts, two collections and two consent configurations. The goal is not identical totals. It is to verify that:expected pages appear; events fire once; sources are readable; filters work; conversions correspond to real success; time zones and domains are correct; access is controlled; sensitive data is absent.8. Use an acceptance-test plan A compact matrix is enough.Test Expected result Evidence StatusPageview One occurrence Network debug To validateSuccessful form One event after success Test ID To validateForm error No conversion Test evidence To validateUTM Readable source/campaign Test URL To validateSensitive parameter Value absent Received request To validateConsent declined Behaviour matches configuration CMP test To validateInternal traffic Excluded or identified Controlled session To validateCross-domain Coherent journey Controlled session To validateMobile CTA and form work Device tests To validateTest:normal and private browsing; mobile and desktop; accepted and declined consent; ad blockers where relevant; redirects; subdomains; languages; successful and failed forms; test campaigns.Store evidence with date, version and owner. 9. Decide what to do with history Historical data does not always need to be imported into the new tool. There are three options. Keep the previous tool read-only This is often simplest where contract, security and cost allow it. Restrict access and set a deletion date. Export an aggregate history Keep the indicators needed for future comparison:monthly traffic; top pages; sources; conversions; objectives; campaign notes; measurement incidents.A documented file or controlled warehouse may be sufficient. Import into the new tool Some providers offer imports. Plausible, for example, documents a Google Analytics import. GA4 can export event data to BigQuery when the link has been configured. An import does not guarantee a perfectly comparable series. Verify:imported scope; missing dimensions; granularity; definitions; time period; duplicates; time zones; consent-related restrictions; storage cost; deletion policy.Do not retain everything merely because it exists. Apply the analytics data retention policy to migrated history. 10. Prepare cutover and rollback The cutover should be reversible. Write a runbook containing:date and time; affected sites; technical owner; business owner; scripts to enable; scripts to disable; CMP configuration; immediate checks; alert thresholds; rollback procedure; communication channel; final approval.Avoid cutover:immediately before a major launch; on Friday evening; during a major campaign; without people available to fix issues; at the same time as a redesign and CRM change.Monitor critical events daily during the first week. 11. Rebuild reports around decisions Do not reproduce every dashboard automatically. Start with:objectives; five KPIs; priority pages; sources; conversions; lead quality; incidents; actions.For multiple properties, use shared naming and separate local reporting from consolidated management. The multi-site analytics dashboard guide provides a structure. Update the monthly web report with a migration note:migration date; previous and new tools; changed definitions; non-comparable metrics; stabilisation period; known anomalies.This note protects later analysis. 12. Decommission the old tool properly The migration is not complete while the previous system remains active without a purpose. Confirm that:scripts are removed from code; tags are removed from the manager; server collection is stopped; API keys are revoked; users and access are removed; webhooks are disabled; scheduled exports are stopped; collection domains are removed; contracts are adjusted; data is deleted or archived according to policy; the register and privacy notice are updated; billing is stopped; documentation is closed.Inspect network traffic after removal. An old tag may survive in a template, plugin, unpublished container or forgotten subdomain. Differences you should accept Differences during migration are normal. They can result from:session rules; consent; blockers; bot filtering; time zones; processing delays; duplicated events in the old system; user definitions; attribution; excluded pages; server-side collection.Assess differences by scenario rather than obsessing over totals. For a critical page or conversion, verify that the trend and operational result make sense. Document structural differences and establish a new baseline after stabilisation. Final checklist Before closing the project, confirm that: objectives and acceptance criteria are written; the old system is inventoried; definitions are documented; unnecessary events are removed; URLs and parameters are filtered; consent and contracts are reviewed; the pilot is validated; critical tests are documented; the history strategy is decided; cutover has a rollback path; reports are rebuilt; the old tool is decommissioned; a new baseline is communicated.Conclusion A good analytics migration does not copy every screen. It preserves useful decisions, clarifies definitions and removes collection that no longer has a purpose. The safest sequence is:inventory; define; reduce; document; pilot; test; cut over; decommission.The expected outcome is not merely a new dashboard. It is a measurement system that is easier to understand and govern. FAQ How long should two tools run in parallel? Only long enough to validate critical scenarios and observe normal operation. The right period depends on traffic and conversion cycles. A long overlap increases complexity, cost and collection. Should the new tool show identical figures? No. Definitions, filters, consent and session rules may differ. Compare scenarios, trends and real conversions rather than demanding artificial equality. Should all historical data be imported? Not necessarily. Keep only what supports obligations, comparisons or future decisions. A documented aggregate history is often more useful than a full but poorly comparable import. How can UTM parameters be preserved? Test redirects, forms and domain changes with controlled campaign URLs. Verify that useful parameters are read before they are removed or normalised. When should the old tool be deleted? After the new setup is validated, necessary history is secured, reports are updated and no integration still depends on the previous system. Sources Sources checked on June 21, 2026.CNIL, audience measurement solutions CNIL, defining data retention periods Google Analytics, set up BigQuery Export Google Analytics, account and property structure Plausible, import stats from Google Analytics OWASP, information exposure through query strings

- 29 Jun, 2026
How to choose an analytics tool: a 15-question governance scorecard
Analytics comparisons often begin with feature lists and end with an overall score that assumes every team wants the same thing. They do not. A B2B small business measuring three sites, sharing reports with an agency and limiting collection has different constraints from an ecommerce group connected to advertising platforms. A technical team willing to operate self-hosted software makes a different trade-off from a marketing team without systems administration. The best tool is not the one with the most features. It is the one whose capabilities, defaults and governance model fit the need. The existing Google Analytics, Matomo and lightweight analytics comparison explains the main families. This scorecard supports an actual procurement decision without relying on a static ranking or prices that will change. Write the problem before scoring tools A serious selection fits on one page before the first demo. Decisions to support List five to ten decisions:Which channels create qualified requests? Which landing pages contribute to conversion? Which content is used? Which sites are growing or declining? Which product events matter? Where did collection break?“Collect all the data” is not a decision. Users Identify marketing, product, management, agency, analyst, engineering, privacy and external-client roles. The key issue is not only user count. It is rights, skills and usage frequency. Constraints Document site count, expected volume, countries, consent requirements, prohibited data, retention, integrations, budget, operating capacity, migration timeline and contractual requirements. This prevents a polished demo from replacing analysis. The 15-question scorecard Score each tool from 0 to 3:0: unavailable or incompatible; 1: possible with a major workaround; 2: covered with acceptable configuration or limits; 3: naturally supported and documented.Apply a weight from 1 to 3 for your organisation. 1. Can it answer business questions without heavy reconstruction? Test five scenarios, such as campaign landing pages, demo requests, three-site comparison, monthly export and traffic-drop diagnosis. A powerful tool that real users cannot operate is expensive. 2. What granularity is genuinely required? Separate aggregate statistics, events, journeys, cohorts, funnels, user identifiers, advertising data and session replay. Each layer adds capability and governance. A team using only pages, sources and conversions should not select primarily for detailed behavioural analysis. 3. What does the default setup collect? Check cookies or identifiers, IP address, full URL, user-agent, geography, advertising IDs, automatic events, query parameters and cross-site signals. Use the URL parameter audit and inspect a test payload. A default aligned with policy scores better because every option to disable is configuration debt. 4. Are strict and extended modes clearly separated? Some teams want minimal measurement by default where the local framework allows it, with extended capabilities after consent. Assess configuration separation, pre-consent behaviour, signal propagation, accidental activation risk, change history and documentation. A vague privacy switch is not enough. 5. Can you explain the data flow? You should be able to state where requests arrive, which transformations occur, where data are stored, which subprocessors participate, whether the vendor reuses data, which support access exists and which transfers apply. Use the data collection summary as the evaluation format. 6. Do location and transfers fit your constraints? Assess hosting region, contracting entity, subprocessors, remote access, transfer mechanisms and self-hosting options separately. “EU hosted” is one fact, not a complete assessment. Self-hosting provides control while transferring operational duties to the team. 7. Can retention, deletion and backups be governed? Ask about available periods, raw versus aggregate data, automatic deletion, property-level deletion, backup purge, exports, contract-end deletion and operational evidence. Unlimited default retention is not neutral. 8. Do multi-site permissions fit? Test per-site roles, groups, agency access, read-only access, exports, admin logs, SSO where needed, offboarding and portfolio views. The multi-site dashboard model turns these into practical scenarios. 9. How does it handle data quality? Review bots, test environments, duplicates, invalid events, unknown parameters, ingestion delay, definition changes, alerts, time zones and cardinality. A simple report without diagnostics may be too shallow. A rich platform with opaque transformations may be hard to audit. 10. Can events and conversions remain governed? Test event creation, change and deprecation. Can schemas be validated? Can fields be forbidden? Are changes versioned? Do historical goals remain understandable? Can an agency change collection without approval? Easy event creation is not always an advantage. Missing guardrails quickly creates an unreadable taxonomy. 11. Is acquisition readable without excessive setup? Test source and medium, UTM campaigns, referrers, direct, landing pages, conversions, custom channels and only the attribution models you genuinely need. Platforms can classify the same journey differently. Ask how rules are defined and changed. 12. Can history be migrated and compared? Check import availability, format, granularity, supported metrics, cost, duration, definition differences, source-data preservation and break-point labelling. An import does not erase differences in sessions, visitors or conversions. 13. Is cost predictable at your scale? Include subscription by volume, overages, sites, users, modules, storage, hosting, maintenance, support, consent management, configuration time, manual reporting, migration and exit. For self-hosting, include updates, backups, monitoring, security and availability. For SaaS, model traffic growth and plan-gated features. Verify prices at decision time. 14. What operating burden can the team sustain? List installation, configuration, tests, maintenance, access, compliance, alerts, backups, support, training and documentation. A free tool can be expensive to operate. A simple tool can be expensive if every useful question requires manual exports. 15. Can you exit cleanly? Evaluate full export, open formats, API, post-cancellation access, deletion, portable configuration, event recovery, definition history and proprietary identifier dependence. A good fit today can still create future debt through lock-in. A weighting example For a multi-site B2B SaaS company:Criterion WeightBusiness questions 3Granularity 2Default collection 3Strict/extended separation 3Data flow 3Location and transfers 2Retention and deletion 3Multi-site access 3Data quality 2Event governance 2Acquisition 2Migration 2Total cost 3Operating burden 3Reversibility 2Calculate: sum(score × weight) / sum(3 × weight)A percentage is convenient, but a two-point difference is not scientific truth. The criteria discussion matters more than the final rank. Add disqualifying criteria Some conditions cannot be offset:unavailable DPA; no deletion; no export; prohibited data collected without control; incompatible multi-site access; unacceptable transfer; cost beyond budget; impossible operating burden; missing essential capability.A tool can score 85% and still fail one critical requirement. Reading the main tool families Rich analytics and advertising suites GA4 integrates deeply with Google's ecosystem and provides broad dimensions, explorations and advertising connections. This can fit trained teams with real attribution and activation needs. It also requires more event governance, configuration and understanding of scopes. Familiarity alone is not a selection criterion. Controllable and self-hostable platforms Matomo offers cloud and self-hosted options with broad functionality. Umami and other open-source projects take more compact approaches. Self-hosting increases infrastructure control, but the organisation owns operations. Decide who patches, restores backups and monitors access. Privacy-first analytics SaaS Plausible, Fathom, Simple Analytics and related tools prioritise readable reporting and often more limited collection. They can reduce setup for essential needs. Simplicity may limit advanced analysis, complex event schemas or some consolidation patterns. Verify actual capabilities, not only philosophy. Emerging products A beta or launch-stage product may align well with governance, but assess maturity, documentation, support, export, stability and demonstrated roadmap. Never score a roadmap promise as an available feature. Run a two-week pilot Day 1: confirm scenarios Select five questions, three roles and two representative properties. Days 2 to 4: deploy a small scope Install each candidate on a test environment or pilot property with the same pages and events. Days 5 to 7: audit collection Compare network requests, documented storage, consent, URL parameters and access. Days 8 to 10: user tests Ask marketing, product and administration users to complete the same tasks without excessive assistance. Days 11 to 12: test export and deletion Export data, revoke access, change retention and review deletion procedures. Days 13 to 14: score and document Complete the scorecard, list disqualifiers and write down accepted compromises. Common selection mistakes Choosing from a demo A demo shows the best workflow, not routine operations. Choosing on privacy alone Privacy is a major design constraint, but the tool must support decisions. An unused solution does not improve governance. Choosing on features alone A feature that expands collection or requires a dedicated team can be a cost rather than value. Comparing prices without future volume Model twelve- and twenty-four-month scenarios. Forgetting people The theoretical best tool fails when nobody understands its reports or maintains its rules. Conclusion A useful comparison does not ask, “Which tool is best?” It asks, “Which tool creates the best compromise for this organisation?” The scorecard makes visible:expected decisions; default collection; governance; access; retention; multi-site needs; total cost; operating burden; exit capability.The result is not a universal score. It is an explainable, reviewable and documented decision. FAQ How many tools should be tested? Three well-chosen candidates are often enough: a rich reference platform, a more controllable option and a simple privacy-first option. Add a fourth only when it represents a genuinely different model. Is self-hosting always more compliant? No. It increases potential control, but compliance still depends on configuration, security, access, purpose, retention and real operations. Can prices be compared once and reused? No. Plans, limits and prices change. Verify them at decision time and model several volumes. How should a roadmap feature be scored? Treat it as unavailable until it can be used and verified. A roadmap can affect risk, but it cannot satisfy a current requirement. What is the difference between a weighted and disqualifying criterion? A weighted weakness can be offset by other strengths. A disqualifying criterion makes the tool incompatible regardless of its total score. SourcesCNIL, Audience-measurement cookies and consent conditions Regulation (EU) 2016/679, data minimisation, transparency and accountability principles Google Analytics, Analytics account structure Google Analytics, Data retention Matomo, Privacy Plausible, Data policy Fathom Analytics, Data policy Umami, Documentation
- 02 Feb, 2026
AI traffic: how to measure visits that ChatGPT, Perplexity and Claude send to your website
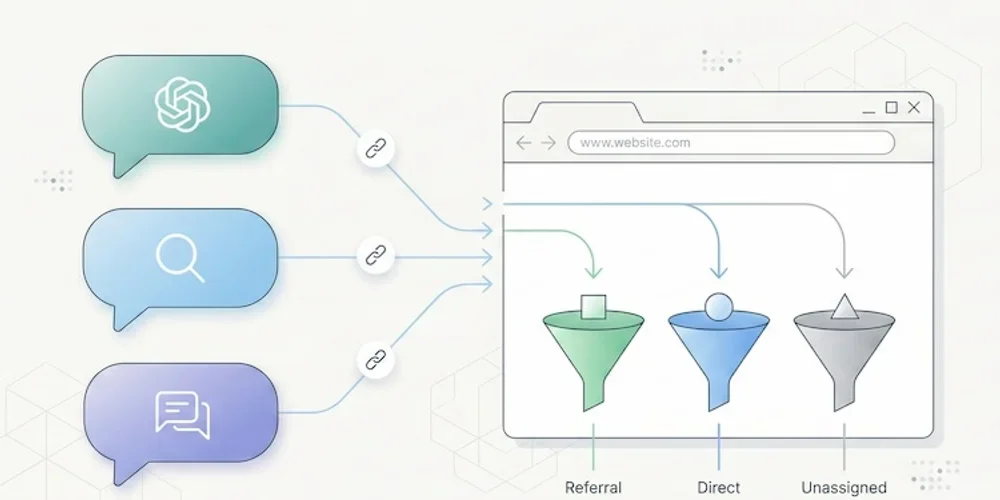
Something has shifted in the way people find your website. And chances are, you have no idea it's happening. Since late 2024, conversational AI platforms have moved beyond answering questions. They now cite sources, insert links, and send real visitors to real websites. ChatGPT, Perplexity, Claude, Gemini, Copilot: these tools are becoming a genuine discovery channel, one that rivals traditional search engines in the quality of traffic it delivers. The catch? Most analytics tools don't separate this traffic. It gets lumped into "referral," blends into "direct," or vanishes from reports entirely. You may already have visitors arriving through a ChatGPT recommendation, and your dashboard won't show it. This article gives you the full playbook: how to spot AI traffic, why it matters, and what to do about it. A new discovery channel, growing fast The raw numbers are still modest. But the trajectory is hard to ignore. A study by SE Ranking covering nearly 64,000 websites across 250 countries (January-April 2025) found that ChatGPT alone accounts for 78% of all AI referral traffic worldwide. Perplexity comes in at roughly 15%, Gemini at 6.4%. Claude and DeepSeek share the remainder at under 1% each, though both show compelling growth curves. (Source: SE Ranking, "AI Traffic in 2025") A separate analysis by Conductor, reported by Search Engine Land, confirms this hierarchy across 13,770 domains and 3.3 billion sessions: AI traffic averages about 1% of total site visits, with ChatGPT generating 87% of it. (Source: Search Engine Land, Nov. 2025) One percent sounds negligible. Two things make it anything but. Growth is strong, but still uneven. Between January and April 2025, ChatGPT's share of global internet traffic doubled in SE Ranking's study, from 0.08% to 0.16%. Some industry analyses also show strong year-over-year growth in AI referral traffic. These figures still need to be read by sector: they do not automatically make AI the first acquisition channel for every site. Traffic quality can be interesting. Visitors arriving from AI platforms spend an average of 9 to 10 minutes per session in SE Ranking's study, compared to 3 to 4 minutes for organic search. Claude-referred sessions in that dataset reached a very high average duration in the EU. These are signals to inspect, not a conversion guarantee: each team should verify landing pages, useful events, and conversions in its own data. The logic is straightforward: a user who clicks a link inside an AI response has already asked a specific question, received context, and chosen to visit your site from among the cited sources. Their intent is pre-qualified. They know why they're coming. Why your analytics can't see it If AI traffic is this valuable, why doesn't it show up clearly in your reports? Three technical issues create this blind spot. The missing referrer problem When someone clicks a link in Perplexity from a web browser, the HTTP Referer header typically passes perplexity.ai as the source. Your analytics tool can then classify the visit as a referral from Perplexity. But this mechanism does not always work. Depending on the context, some sessions from AI tools may not pass a usable referrer. The reasons vary: mobile apps (ChatGPT on iOS, Copilot in Windows) may open links in internal webviews, some AI agents prefetch or preview pages without triggering the analytics script, and AI browsers such as Perplexity Comet or ChatGPT Atlas do not all pass signals the same way. (Source: MarTech, Nov. 2025) The result: a significant portion of AI traffic falls into the "direct" or "unassigned" bucket in your analytics, invisible and unattributed. GA4's default classification Google Analytics 4 can classify visits from AI assistants as "referral," the same category as a link from Facebook, a forum, or a directory listing. In the setups observed when this article was first written, teams still needed their own grouping to isolate this traffic. Always verify the current GA4 interface before documenting the procedure. In practice, if you open your acquisition report in GA4 without custom configuration, ChatGPT traffic is buried among dozens of other referral sources. For a site receiving hundreds of different referrers, spotting chatgpt.com or perplexity.ai requires knowing what to look for. The bot-vs-human confusion AI platforms interact with your site in two fundamentally different ways. The first is referral traffic: a human clicks a link in an AI response and lands on your page. This is real traffic with a real visitor. The second is crawling: AI platform bots (GPTBot for OpenAI, PerplexityBot, ClaudeBot, and others) visit your site to index content and feed their models. This crawl traffic is not useful audience data. It's data harvesting. GA4 automatically filters known bots, but the list isn't comprehensive. Some newer AI bots slip through, while some legitimate human visitors from AI tools get incorrectly filtered. Cloudflare has observed crawl-to-referral ratios as high as 700:1 for Perplexity, which gives a sense of how much harvesting activity exists relative to actual human visits. (Source: Digiday, Dec. 2025) How to identify AI traffic in your tools Two approaches work, depending on what you're using. In GA4: create a dedicated "AI Traffic" channel The recommended method is to build a custom channel group that aggregates all known AI sources. Here's the process:In GA4, go to Admin > Data Settings > Channel Groups. Click the default channel group, then "Copy" to create a new one. Add a channel called "AI Traffic." Set the rule: Match type = "matches regex", then paste this pattern:(chatgpt\.com|chat\.openai\.com|perplexity\.ai|claude\.ai|gemini\.google\.com|copilot\.microsoft\.com|deepseek\.com|meta\.ai)Drag your "AI Traffic" channel above the default "Referral" channel in the priority order. This is critical: GA4 evaluates rules top-down, and if "AI Traffic" sits below "Referral," visits will be classified as referral before reaching your rule.This setup only applies to new data (no retroactive effect). Allow a few days before results appear. For a one-time analysis of historical data, create an Explore report with a filter on "Session source" using the same regex. (Source: MarTech, Nov. 2025) In a lightweight analytics tool (Plausible, Fathom, etc.) This is where a well-designed simple tool can help. In Plausible, the "Sources" report displays every identified referrer directly. If chatgpt.com or perplexity.ai appears as a source, you can inspect it without creating a custom channel first. Click the source to filter the dashboard by that origin and analyze entry pages, time on site, and triggered events. Plausible documented its own experience: in 2024, the Plausible blog saw a 2,200% surge in AI referral traffic within months, all identifiable from their standard dashboard with zero configuration. (Source: Plausible, Dec. 2024) This is a textbook case where the frugal analytics philosophy helps: when a tool is designed to surface essential data without layers of configuration, emerging signals are easier to inspect. A tool like GA4 remains powerful, but it often requires dedicated configuration to isolate a new family of sources. For a broader view of analytics tool families, see our Google Analytics, Matomo, and frugal analytics comparison. AI referral traffic vs AI crawling: two different things A common mistake is conflating referral traffic (humans clicking) with crawling (bots scraping). They deserve separate attention because they raise different questions. AI referral traffic is an opportunity. It represents a qualified, pre-informed visitor arriving with intent. Measuring it lets you optimize landing pages, adapt content, and understand how AI platforms perceive your site. AI crawling is a governance question. Bots like GPTBot, PerplexityBot, and ClaudeBot visit your site to train their models or answer user queries in real time. Some do so aggressively: Cloudflare found that GoogleBot's crawl volume (which also feeds Gemini) dwarfs that of all other AI bots combined. You can control crawling through your robots.txt file: User-agent: GPTBot Disallow: /User-agent: PerplexityBot Disallow: /User-agent: ClaudeBot Disallow: /But beware the paradox: blocking the crawl can reduce your referral traffic. If an AI can't index your content, it can't recommend it to users. This is a trade-off to make deliberately. An emerging approach uses an llms.txt file (a Markdown file placed at your site's root) to guide AI platforms toward the content you want to make accessible, without blocking all crawling. Anthropic (the company behind Claude) uses this mechanism on its own site. How to get cited by AI platforms Understanding AI traffic also means understanding what triggers it. AI platforms don't cite sites randomly. Several factors drive citations. Content structure matters. Analyses cited by Superprompt suggest that pages with clear heading hierarchies (H2, H3, lists) and direct answers are easier for AI systems to reuse. Structured FAQ sections are particularly useful because they match the question-and-answer format of AI interactions. Freshness can help. Recently updated content is often easier to use in answers that need current information. The effect still depends on topic, domain authority and how the AI platform retrieves sources. Original data attracts citations. Data tables, proprietary statistics and exclusive benchmarks can be easier to cite than generic content. This is another argument for precise, data-driven KPIs over vanity metrics. Traditional SEO remains the foundation. Several market studies connect AI visibility with conventional SEO signals: structure, authority, freshness and editorial clarity still matter. SEO doesn't depend on Google Analytics, but it remains part of the foundation for AI visibility. What this means for choosing an analytics tool AI traffic exposes an operational limit in complex analytics platforms: emerging signals often need prior configuration before they are easy to read. With GA4, you need to create a channel group, write a regex, update it regularly (new AI tools launch every month), and accept that the data won't be retroactive. It's doable, but it demands technical expertise that most small business owners and freelancers simply don't have. With a well-designed lightweight analytics tool, AI referrers can appear directly in the sources report, right alongside Google, LinkedIn, or Twitter, when the referrer is actually transmitted. That does not remove webview, direct or prefetch limits, but it makes visible signals easier to read. That's the core principle of analytical sobriety: collect less data, but make every data point immediately readable. AI traffic is not something to ignore. It is one signal of a change in how some people discover content online. Sites that measure it today will mostly have a clearer read on emerging sources, without overstating a volume that often remains small. The question is no longer whether AI platforms send traffic to your site. It's whether your measurement tool shows it to you.Frequently asked questions What percentage of my traffic comes from AI? Late-2025 studies still place identifiable AI traffic at a small share of total traffic, with large variations by sector. That only reflects identifiable traffic: when an AI session lacks a usable referrer, it can fall into "direct" and remain difficult to attribute. How do I see ChatGPT traffic in Google Analytics 4? If your GA4 interface does not yet provide an AI channel that fits your needs, create a custom channel group: go to Admin > Data Settings > Channel Groups, add an "AI Traffic" channel with a regex rule covering AI domains (chatgpt.com, perplexity.ai, claude.ai, gemini.google.com, copilot.microsoft.com). Place it above the "Referral" channel in the hierarchy. Data will only be collected from the date you create the channel. Should I block AI bots with robots.txt? It's a trade-off. Blocking AI bots (GPTBot, PerplexityBot, ClaudeBot) via robots.txt prevents your content from being indexed by these platforms, which may reduce citations and referral traffic. On the other hand, not blocking means your content feeds AI model training, raising intellectual property and consent questions. A middle-ground approach uses an llms.txt file to guide AI platforms toward the content you want them to access. Can cookieless analytics detect AI traffic? Yes, when a usable referrer is transmitted. Cookieless tools like Plausible, Fathom, or Simple Analytics can display those referrers directly in their sources report without a dedicated channel group. That is often easier to inspect, but it does not solve referrer, direct or prefetch limits. How do I optimize my content to get cited by ChatGPT or Perplexity? Five levers are worth testing: structure content with clear headings (H2/H3) and FAQ sections; keep content fresh when the topic requires it; produce original data (tables, statistics, benchmarks); maintain strong traditional SEO; and consider an llms.txt file to make structured content easier for AI crawlers to access. Effects vary by platform and topic, so document your assumptions before turning them into an editorial rule.Sources and figures were checked for the initial February 2026 publication. AI traffic shares and GA4 classifications evolve quickly: verify the current interface and documentation before turning this into an internal rule. Sources Sources checked on May 10, 2026.SE Ranking, "AI Traffic in 2025: Comparing ChatGPT, Perplexity & Other Top Platforms" Search Engine Land, "AI sends 1% of website traffic — and most of it is from ChatGPT" MarTech, "How GA4 records traffic from Perplexity Comet and ChatGPT Atlas" Plausible Analytics, "Breaking down our 2.2K% surge in AI traffic"

- 05 Jan, 2026
Why the Era of 'Data Obesity' Is Paralyzing Small Businesses (And How to Break Free)
We were sold a dream. The "Big Data" dream. For the past decade, the promise made to SMB owners, SaaS teams, and marketing managers has been the same: "The more data you collect about your visitors, the better you'll sell." The reality in 2025? It's often the opposite. Tools have become bloated, data piles up unread, and decisions are slower than before. This is what we call data obesity: the accumulation of data that doesn't serve decisions, but costs you in time, money, compliance, and performance. In short:Too much data kills decisions: information overload clutters dashboards and paralyzes action. The "Vanity Metrics" trap: you track flattering curves instead of focusing on what actually drives revenue. A triple cost: technical (slower site), legal (GDPR), and trust (visitors refusing tracking). The solution exists: frugal analytics — measure less, decide better.1. The "Dashboard Nobody Looks At" Syndrome Open your current analytics tool. In under 10 seconds, can you tell:whether your week was good? which page generated the most leads? which traffic source is performing best?If the answer is no, you're not alone. You're in the overwhelming majority. Big Data Isn't for SMBs Eurostat's Digitalisation in Europe publication frames advanced digital adoption as a 2030 objective: 75% of EU companies should use cloud computing, perform big data analysis, or use artificial intelligence. The same source shows the gap by company size: in 2022, 98% of large businesses reached a basic level of digital intensity, versus 69% of SMEs. → Source: Eurostat – Digitalisation in Europe, technology uptake in businesses Yet these same SMBs end up with tools designed for 20-person data teams. GA4 offers hundreds of reports, dozens of dimensions, customizable explorations. For a 2-person marketing team, it's like getting an airliner cockpit when all you need is a car dashboard. The Choice That Paralyzes The abundance of options, reports, and dimensions creates user fatigue. This is a well-documented phenomenon in behavioral science: choice overload. The more options you have, the less capable you are of choosing — and the less satisfied you are with your choice when you make one. → Source: The Decision Lab – Choice Overload Bias Applied to analytics: more information ≠ better decisions. On the contrary, too much data leads to inaction. You close the tab and fly blind.2. The Race for "Vanity Metrics" In many small businesses, the metrics sitting at the top of dashboards are also the ones least useful for decision-making:pageviews (without knowing which pages convert), total session count (without distinguishing prospects from bots), bounce rate (an ambiguous metric, often misinterpreted), visitors by country (rarely actionable for a local business).These metrics flatter the ego — "we had 10,000 visits this month!" — but they say nothing about a site's actual performance. The 3-Question Test For a small business, a useful dashboard should answer three questions:How many people are discovering my site? (acquisition) Which pages generate the most inquiries or sales? (performance) What does that represent each week? (results)If your tool can't answer these immediately, it's pulling you away from your main goal: understanding what works so you can grow your business. We've detailed which metrics to keep (and which to ignore) in our guide to The "5 KPIs" Method.3. The Hidden Cost of Complexity Data obesity doesn't just cost time. It has three concrete costs that most businesses underestimate. 3.1 The Technical Cost: A Slower Website Traditional analytics tools often ship heavy scripts that degrade Core Web Vitals — the web performance metrics Google uses as a ranking factor. An independent audit by Bejamas shows that third-party scripts (analytics, chat widgets, marketing pixels) can significantly slow down page loads, with analytics scripts often leading in main-thread blocking time. → Source: Bejamas – How Popular Scripts Slow Down Your Website The GA4 script weighs approximately 45 KB compressed in the cited measurements. Frugal alternatives often sit between 1 and 6 KB. As we explain in our article on SEO without Google Analytics, lighter third-party scripts can contribute to better Core Web Vitals, even though the result always depends on the full page. Slower sites = fewer conversions = less revenue. 3.2 The Legal Cost: GDPR Risk The more signals you collect — precise geolocation, cross-page navigation, technical fingerprinting, per-page session duration — the higher your legal exposure. Every piece of data collected is a piece of data to protect, to document in your processing registry, and to justify during an audit. European Data Protection Authorities — including the French CNIL — describe a narrow path for audience measurement tools that meet strict conditions. The practical lesson is not "no banner by default"; it is that minimal collection, clear documentation, and a correctly configured tool reduce compliance burden. → Source: CNIL – Audience measurement solutions This is probably the most underappreciated argument for frugal analytics: collecting less reduces the surface you need to document and can simplify review. It does not remove the need to assess purposes, visitor information, possible consent requirements, or the other trackers on the same site. For the formal criteria, use the CNIL page and document your own configuration. 3.3 The Trust Cost: Visitors Who Refuse Another side effect of traditional analytics: cookie banners. According to data from European regulators, cookie refusal rates have risen significantly since enforcement began in earnest. Depending on consent rates, browsers, blockers, geography and the broader tracker stack, a classic cookie-banner setup can materially reduce measured traffic. → Source: CNIL – Cookie action plan impact evaluation In some sectors, ad blockers and script blockers amplify the gap further. Result: your dashboard can under-represent part of the measurable audience. The size of that gap is context-specific. A cookieless-by-default tool reduces dependence on acceptance rates for the audience-measurement layer. Your final consent UI still depends on the full tracker stack, including advertising pixels, personalization, or session replay.4. The Solution: Frugal Analytics Frugal analytics isn't about measuring less out of laziness or ideology. It's about measuring better, by focusing on what:concretely helps you make decisions, respects visitor privacy, doesn't slow down your site, limits some legal-review friction.What It Changes in PracticeBefore (Data Obesity) After (Frugal Analytics)200+ metrics available 5-7 actionable KPIsDashboard opened once a month (and closed immediately) Dashboard checked weekly, understood in 30 secondsConsent UI driven by broad tracker stack Cookieless-by-default audience baselineHeavy script, possible Core Web Vitals impact Lighter script, impact to measure in contextComplex GDPR compliance (CMP, registry, proxying) Minimal collection and more readable review40-page monthly report 10-line results-oriented reportFrugal analytics is the equivalent of seasonal cooking: fewer ingredients, better chosen, better prepared. The result is superior to accumulation. The Core PrinciplesCollect only what drives decisions. If a data point wouldn't change your actions, don't collect it. Simplify to democratize. A dashboard the founder understands is worth more than a report only the data analyst can interpret. Respect by design. Compliance shouldn't be a bolt-on ("let's proxy GA4 to reduce risk") but a prerequisite: choose collection boundaries that are clear, minimal and documentable. Measure performance, not people. Aggregated trends (popular pages, traffic sources, conversion rates) are more useful and less risky than individual-level tracking.5. Where to Start If you're convinced your current analytics is too complex, here are the first three steps. Step 1: Identify your 5 KPIs. Use the 5 KPIs method to define the only metrics that matter for your business. If an indicator doesn't pass the test "would I change how I work if this number moved?", remove it. Step 2: Evaluate your current tool. Compare it honestly against the alternatives. Our analytics tool comparison details the strengths, weaknesses, and pricing of each family (GA4, Matomo, frugal). Step 3: Test. Most frugal solutions install quickly with a short script and offer a free trial. Run both tools in parallel for a month. Compare: which one gives you an answer faster?Conclusion: Put Your Analytics on a Diet The era of collecting data "just in case" is behind us. Regulation, web performance, and common sense all converge on the same conclusion: less data, better chosen, is better for everyone — for the business, for visitors, and for the web. For 2026, the best strategy for an SMB isn't adding dashboards — it's removing them. Less noise. Less friction. More concrete decisions. Frugal analytics means putting data in service of the business, not the other way around.FAQ: Understanding Frugal Analytics What is frugal analytics? An approach to audience measurement that limits collection to the strict minimum needed to make business decisions. It's built on three principles: collect only what drives action, prefer aggregated data over individual profiles, and choose tools with clear collection boundaries (no measurement cookies, no user profiles). Which metrics should I absolutely keep? Unique visitors, traffic sources, top pages, key events (CTA clicks, form submissions), and conversions. These 5 metrics are enough to steer a brochure site, a blog, or a small e-commerce store. Everything else is bonus — or noise. Can you do frugal analytics with GA4? Technically yes, but it requires advanced expertise: disabling granular collection, configuring consent mode, reducing some transfer or collection risks, and building custom reports limited to essential KPIs. For most SMBs, it is simpler to choose a natively frugal tool and then document the actual setup. Is frugal analytics enough for e-commerce? For a small e-commerce site (under 1,000 orders/month), yes. The 5 essential KPIs cover acquisition, engagement, and conversion. For e-commerce with multi-channel attribution, retargeting, or advanced segmentation needs, a more comprehensive tool (Matomo, GA4) will be necessary — but the frugality principle still applies: start with the essentials, and add complexity only if it's justified. How many businesses actually use Big Data? Eurostat's Digitalisation in Europe data shows a persistent size gap in digital intensity: in 2022, 98% of large businesses reached a basic level, versus 69% of SMEs. Most small teams do not have the people, tools, or need to exploit massive datasets. Frugal analytics is the approach suited to this reality. SourcesEurostat, Digitalisation in Europe: technology uptake in businesses CNIL, Cookies: audience measurement solutions CNIL, Cookie action plan impact evaluation Google Search Central, Core Web Vitals and Google Search results