Tag: Smb
All blog posts with this tag.
- 20 Apr, 2026
A minimal analytics tracking plan for SMBs: 12 events are enough to run a website
For years, many teams approached analytics tracking as an endless checklist. Track everything, name everything, enrich everything, and hope that one day someone will actually use the data. In practice, that usually creates the opposite result. The tracking plan grows too wide, the event list becomes messy, parameters get harder to read, and the dashboard stops helping people make decisions. The tool collects more, but the team understands less. For an SMB, a B2B website, a lead generation site, or a small SaaS property, the right logic is usually much simpler: measure less, but measure what helps you act. That is what a minimal tracking plan is for. It does not try to describe every micro-interaction. It tries to answer a few useful questions:where traffic comes from; which pages attract attention; which pieces of content create intent; which actions suggest progress; which actions count as real conversions.This article offers a practical framework with 12 events at most. It is not a universal truth. It is a robust starting point for teams that want analytics to stay readable, governable, and useful. A tracking plan is not a technical inventory, it is a decision framework The first mistake is to start from the tool. You open the documentation, discover dozens of recommended events, and then try to squeeze all of them into the site. That is the wrong direction. A good tracking plan starts with the decisions the team needs to make. For example:Which pages actually support acquisition? Which content drives lead generation? Which calls to action work? Where do visitors drop off? Which signals deserve a monthly review, and which ones are just curiosity?Until those questions are clear, adding more events does not help much. Google Analytics 4 explicitly separates automatically collected events, recommended events, and custom events. The key point is not that many options exist. The key point is that a team does not need all of those options to get useful analytics. The same is true with tools such as Matomo and Plausible. They can track actions beyond pageviews. That capability is valuable. It becomes counterproductive when it pushes teams to document every movement on the site. What a minimal tracking plan should cover For SMBs, a lean tracking plan should cover five areas. 1. Core audience reading Before adding events, you still need the basics:pageviews; landing pages; sources or referrers; campaigns when they are actively used; main conversions.In other words, event tracking should not compensate for a weak audience dashboard. If your reporting does not already explain which pages attract qualified traffic, twenty extra events will not fix that. 2. Intent signals Not every visitor converts right away. You need a few intermediate signals: a strategic CTA click, a file download, internal search, a demo request, the start of signup, and similar actions. These signals help you read progression. They should not become an artificial funnel for its own sake. 3. Real conversions A minimal plan should identify what actually matters for the site:form submissions; booked meetings; trial starts; confirmed purchases; validated signups.If an action does not influence any decision, it probably does not need to exist as an event. 4. Obvious friction points The goal is not to replay every session. The goal is to see where intent gets lost. Repeated internal searches, clicks to pricing with no follow-up action, or checkout starts without completed purchases can already be enough to reveal a problem. 5. Tracking governance A tracking plan without governance drifts quickly. You should know:why the event exists; who asked for it; where it fires; which parameters are actually useful; when it can be removed.This is often the difference between a clean setup and an accumulative one. The 12 events that are enough in most cases Here is a simple model. Not every team will need all 12. Many can start with 6 to 8. 1. form_submit This is the most universal event. It covers contact forms, quote requests, demo forms, and inbound lead forms. Why track it: it captures explicit intent. Useful parameters:form_name page_type2. demo_request If your B2B site offers demos, it is worth distinguishing that action from a generic form. It often reflects stronger intent. Why track it: it separates general contact from more qualified demand. Useful parameter:placement3. newsletter_signup This is usually secondary compared to commercial intent, but it can still be a strong content signal. Why track it: it measures a lighter conversion that is useful for content teams. Useful parameters:placement content_type4. account_signup For SaaS products or member areas, the start of signup nearly always deserves dedicated tracking. Why track it: it shows the move from visit to account creation. Useful parameters:plan_type placement5. trial_start If a trial exists, it should be tracked separately from a simple signup. Volume may be lower, but the signal is much closer to revenue. Why track it: it brings analytics closer to the real pipeline. Useful parameter:plan_type6. purchase_complete For ecommerce sites or SaaS products with direct subscription, this is the most important end-state event. Why track it: it anchors the setup in real conversion rather than vague intent. Useful parameters:plan_type billing_cycle7. phone_click On many local business, consulting, services, and B2B sites, the phone is still a conversion path. Why track it: not every conversion goes through a form. Useful parameter:placement8. email_click The same applies to mailto links. On some sites, this matters more than another decorative click on a product page. Why track it: it shows direct contact intent. Useful parameter:placement9. file_download White papers, brochures, product sheets, or PDF documentation can indicate serious intent, as long as you stay selective. Why track it: it helps identify the assets that generate tangible engagement. Useful parameters:file_name content_type10. outbound_click Not every outbound click deserves tracking. But some external links are strategic: Calendly, payment platforms, partner portals, marketplaces, or core documentation. Why track it: it explains useful exits from your site. Useful parameters:destination_type placement11. search_submit If your site includes internal search, it is often one of the most revealing signals. Visitors are telling you what they are looking for. Why track it: it reveals the gap between site architecture and user intent. Useful parameters:query_group results_stateImportant: avoid sending raw search terms if that creates unnecessarily sensitive collection. Grouping or aggregation is often the better choice. 12. checkout_start or pricing_cta_click The twelfth event depends on the type of website. For ecommerce: track checkout_start. For B2B sites without direct purchase: track pricing_cta_click or another major commercial CTA. Why track it: it captures the shift from interest to active intent. Useful parameters:placement offer_typeThe real discipline: limit parameters A bad tracking plan does not only contain too many events. It also contains too many properties attached to each event. A simple rule works well here: only keep parameters that change how you read performance. For example:placement can help compare a CTA in the header and footer; plan_type can help separate free, starter, and pro; form_name can help if several forms exist.By contrast, many parameters create little value:the exact button text; the full URL when it is already visible elsewhere; casing variations and naming inconsistencies; redundant details that mostly complicate analysis.Plausible, for example, lets you attach custom properties to events. That is useful. But technical possibility is not the same as analytical necessity. The more you enrich, the more you have to read and maintain later. A simple naming convention beats a complex framework For a minimal plan, the following convention is enough:event names in English; clear action verbs; no spaces; no near-duplicates; stable meaning over time.Good examples:form_submit trial_start file_download phone_clickAvoid names like:CTA Final Hero Demo contactFormSuccessNew btn_click_v2 conversion_importantThe rule is simple: the name should still make sense six months later, even to someone who was not part of the original implementation. What not to track first A minimal plan also means accepting what not to measure. Do not start by tracking:every scroll; every navigation click; every accordion open; every hover; every visual button variation; every video interaction if nobody uses that data; every micro-step of a long form unless a proven problem exists.This data can feel reassuring because it looks detailed. In reality, it often creates noise. The recommended implementation order To avoid turning tracking into an endless project, deploy in three waves. Wave 1: main conversions Start with:form_submit demo_request purchase_complete trial_startNot every team will have all four, but every team should start with the events closest to value. Wave 2: intent signals Then add:phone_click email_click file_download checkout_start or pricing_cta_clickThat is often enough to read the useful middle of the journey. Wave 3: orientation signals Only then, add if needed:search_submit newsletter_signup account_signup outbound_clickThis sequence keeps tracking under control. First document what supports decision-making, then what improves interpretation. A simple example of a minimal tracking table This documentation format is enough for most SMBs:Event Trigger Why track it Parametersform_submit successful form submission measure inbound leads form_name, page_typedemo_request demo click or confirmed request isolate strong commercial intent placementnewsletter_signup confirmed signup measure content-driven conversions placement, content_typeaccount_signup signup started or completed read visit → account progression plan_type, placementtrial_start trial activated track the signal closest to revenue plan_typepurchase_complete purchase or subscription confirmed measure the final conversion plan_type, billing_cyclephone_click click on phone link capture non-form conversions placementemail_click click on mailto link follow direct contact intent placementfile_download file download triggered measure interest in key assets file_name, content_typeoutbound_click click to a strategic external domain understand useful exits destination_type, placementsearch_submit internal search submitted read user intent query_group, results_statecheckout_start or pricing_cta_click checkout started or key pricing CTA clicked identify the shift to action placement, offer_typePrivacy matters, even in a minimal setup This point matters. A minimal tracking plan is not automatically a legally simple one. The CNIL makes clear that audience measurement can, under certain conditions, fall within a specific regime, but the analysis still depends on purposes, configuration, and actual data use. Once you move into broader marketing use cases, acquisition logic, or richer reuse, the compliance analysis changes. In practical terms, that means two things:keep the tracking plan proportionate; clearly separate useful audience measurement from broader marketing needs.In other words, a good tracking plan is not just lean. It is also explainable. What to keep in mind For SMBs, a good tracking plan is not trying to impress anyone. It is trying to remain usable. In most cases, 12 events are more than enough, and often 6 to 8 are enough to start well. The key is not to build an ambitious taxonomy. The key is to answer a few simple questions every month:what attracts qualified traffic; what creates clear intent; what actually converts; where progress gets lost; which data the team truly understands and uses.If your tracking plan becomes more complex than your decisions, it is probably already too heavy. FAQ Should we implement all 12 events on day one? No. Most teams should start with the 4 to 8 events closest to real conversions, then expand only when a clear use case appears. Why keep event names in English on a non-English site? Because it often makes maintenance, technical consistency, and future transcreation easier. The important thing is not the language itself, but stable naming. Is a button click enough to count as a conversion? Not always. A click can be a useful intent signal, but it does not replace a real conversion such as a submitted form, an activated trial, or a confirmed purchase. Can campaigns and UTM data fit in a minimal setup? Yes, but acquisition reporting and event tracking are not the same thing. Campaign data can be useful, but it does not justify an inflated event taxonomy on its own. How do we know an event should be removed? If nobody looks at it, if it drives no decision, if it duplicates another signal, or if nobody on the team can explain why it exists, it probably deserves to go. SourcesCNIL, Cookies: solutions for audience measurement tools: https://www.cnil.fr/fr/cookies-solutions-pour-les-outils-de-mesure-daudience CNIL, Recommendation on cookies and other trackers, consolidated 2026 edition: https://www.cnil.fr/sites/default/files/2026-01/recommandation_cookies_consolidee.pdf Google Analytics, Analytics - Recommended events: https://developers.google.com/analytics/devguides/collection/ga4/reference/events Google Analytics, Set up events: https://developers.google.com/analytics/devguides/collection/ga4/events Google Analytics, Set up event parameters: https://developers.google.com/analytics/devguides/collection/ga4/event-parameters Matomo, JavaScript Tracking Client Guide: https://developer.matomo.org/guides/tracking-javascript-guide Matomo, Event Tracking User Guide: https://matomo.org/guide/reports/event-tracking/ Plausible, Custom event goals: https://plausible.io/docs/custom-event-goals Plausible, Custom properties for events: https://plausible.io/docs/custom-props/for-custom-events Plausible, Goal conversions: https://plausible.io/docs/goal-conversions
- 12 Jan, 2026
The "Less is More" Method: 5 Metrics Are All You Need to Run a Profitable Website
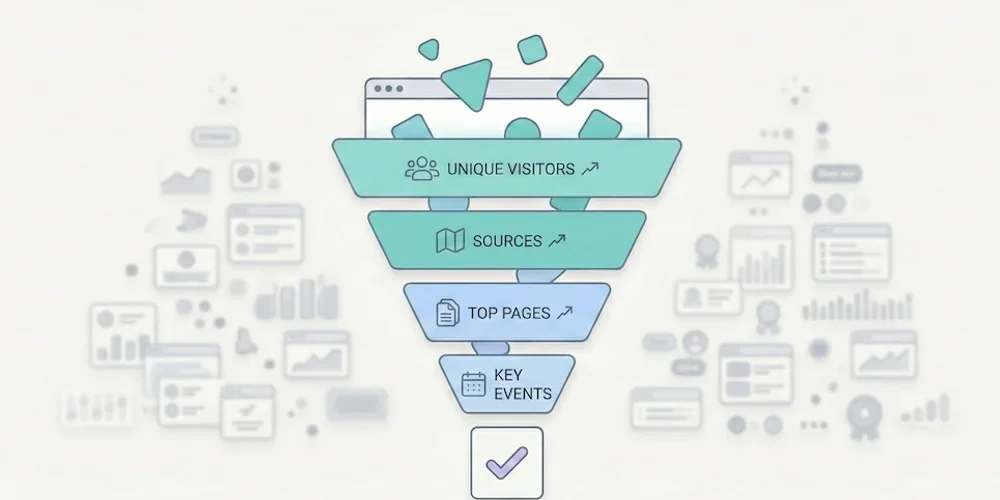
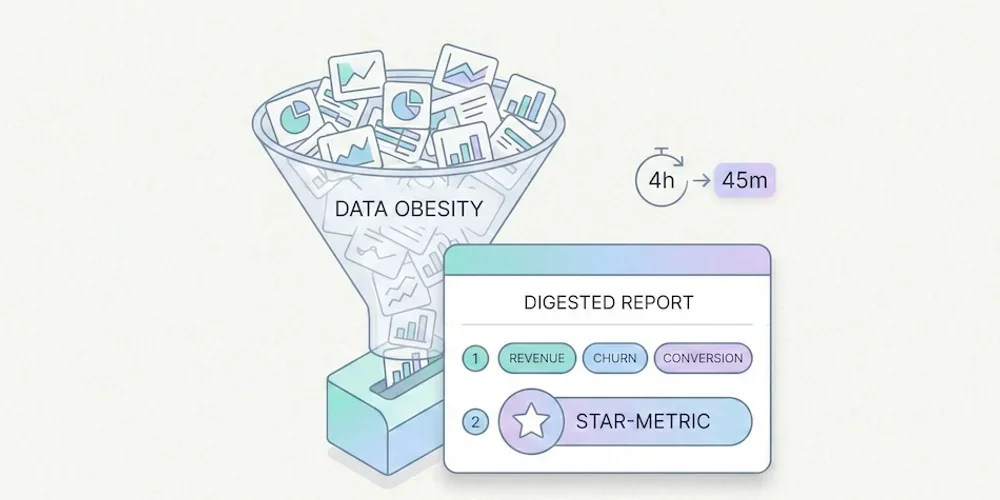
Opening your web analytics tool often feels like popping the hood of a modern car without being a mechanic: you can see it's complex, you hope everything's working, but you have no idea what to touch. That's normal. According to Eurostat, 44% of Europeans lack basic digital skills. It's not your fault if you can't make sense of your traffic reports — it's because the tools are designed for experts, not for business owners. → Source: Eurostat – Digital skills of individuals The good news? To grow your business, you don't need to become an expert. You just need to apply the Pareto principle: ignore 80% of the noise and focus on the 20% of metrics that impact your revenue.1. Why Measuring Everything Means Measuring Nothing The classic SMB mistake is thinking: "I'll record everything just in case." The result is a "Christmas tree" dashboard: bounce rate, average session duration, pages per visit, user flows, predefined events, real-time reports… When everything blinks, nothing matters. We've detailed this phenomenon in our article on data obesity: information overload produces paralysis, not decisions. Choice overload applies to metrics too. To adopt a frugal approach, filter your data with one question: "If this number changed tomorrow, would I change how I work?"If the answer is no → it's noise. Remove it from your dashboard. If the answer is yes → it's a KPI (Key Performance Indicator). Keep it.When you apply this filter rigorously, nearly every SMB arrives at the same 5 metrics. No more, no less.2. The Only 5 Metrics You Need Here's the ideal setup for a brochure site, a blog, or a small online store. These 5 KPIs cover the entire visitor journey: from discovery to conversion. KPI 1 — Unique Visitors (Your Real Audience) The number of distinct people who visited your site over a given period (not clicks, not "sessions" — people).The business question: "Is my audience growing? Are more people finding me?" Reading frequency: Weekly. Compare week over week to see the trend, not day by day (daily fluctuations are noise). The trap: Don't confuse "unique visitors" and "pageviews." If one person visits 10 pages, that's 1 visitor and 10 pageviews. It's the visitor count that measures your actual reach.KPI 2 — Traffic Sources (Where Do They Come From?) How your audience breaks down by channel: Google (SEO), social media, direct access, email, paid ads, referrals.The business question: "Where should I invest my time and money?" Why it's critical: According to Eurostat, 60% of EU businesses are on social media, but many are flying blind. This metric tells you whether the hours spent on LinkedIn, Instagram, or TikTok are actually paying off — or if SEO is doing the real work. The trap: Make sure your campaigns are tagged with UTMs. Without UTMs, traffic from your newsletters, social posts, or ad campaigns gets bucketed into "Direct" or "Referral," which corrupts your analysis.→ Source: Eurostat – Social media use by enterprises KPI 3 — Top 5 Pages (What Actually Interests People) Your 5 most visited pages, ranked by unique visitors.The business question: "What topics attract my prospects?" What you often discover: The "Service A" page (the one you spent weeks on) never gets read, while an old blog post or FAQ page attracts everyone. These surprises are gold: they tell you what your market actually wants to know. How to act: If a page attracts lots of traffic but doesn't convert, add a clear call-to-action. If a page converts well but has little traffic, invest in promotion (SEO, social, paid).KPI 4 — Key Events (Engagement) The concrete actions visitors take: clicking "Call," downloading a PDF, watching a video, adding to cart.The business question: "Is my site engaging, or are people just passing through?" Why this beats "engagement rate": GA4's automatic metrics (engagement rate, session duration) are ambiguous and hard to interpret. An explicit event ("clicked the Quote button") is crystal clear and directly tied to business value. How to set up: Most frugal analytics tools let you define custom events in a few clicks, with no Tag Manager required. Identify the 3-5 actions that matter on your site and track only those.KPI 5 — Conversions (The Bottom Line) The number of forms submitted, calls triggered, or sales completed. This is the only number that matters at the end of the month.The business question: "How much revenue did this site generate this week?" The trap: Many sites don't track conversions at all. The contact form sends an email, but nobody counts how many forms are submitted per week. Without this data, you can't tell whether your site is a profitable investment or a cost center. How to set up: Define a "goal" in your analytics tool (form submission, "Buy" button click, confirmation page visit). It's the most important metric and often the simplest to implement.3. The Minimalist Dashboard Here's what your weekly review should look like. One table, 5 rows, 2 minutes of reading.KPI This Week Last Week TrendUnique visitors 1,230 1,050 ✅ +17%Top source Google (62%) Google (58%) ✅ SEO growingTop page /blog/gdpr-article /services ℹ️ New content performingKey events 45 "Quote" clicks 38 ✅ +18%Conversions (forms) 12 9 ✅ +33%Reading time: 30 seconds. Possible decision: "SEO and blog content are working — keep going. Form submissions are up — no need to change the contact page." That's it. No charts to interpret, no segments to configure. If you're a freelancer or agency, this is also the perfect basis for effective client reporting.4. Quick Diagnosis: How to Act This diagnostic table covers the most common scenarios. Find your situation and apply the recommendation.Scenario Diagnosis ActionLots of visitors (#1) but few conversions (#5) Your offer isn't clear, or your form is off-putting Simplify the contact page (fewer fields). Add a visible CTA on high-traffic pages.Few visitors (#1) but high conversion rate (#5) Your site converts well, but nobody can find it Invest in acquisition: SEO (content), targeted ads, or social media. The site is ready.High social traffic (#2) but few conversions (#5) You're attracting "tourists" who aren't your target Shift your social content strategy to attract prospects, not just curious browsers. Or accept that social serves awareness, not conversion.Top page = homepage (#3) and nothing else Visitors aren't going deeper Your navigation is confusing or your internal content isn't compelling. Improve internal linking and CTAs.Many "Quote" clicks (#4) but few form submissions (#5) The form is too long or broken Test the form yourself on mobile. Reduce the number of fields. Check it works across browsers.Traffic dropped for 2 weeks Technical or seasonal issue Check Search Console (indexing errors?). Check your analytics script (still installed?). If everything's fine, it's likely seasonal — compare to the previous year.One blog post dominates the Top 5 (#3) That topic interests your market Create more content on this subject. Add a relevant CTA to that article. Offer a lead magnet (PDF, newsletter) to readers.5. Metrics to Ignore (and Why) For completeness, here are the indicators you can safely remove from your dashboard. Bounce rate. If a visitor arrives on your contact page, finds your phone number in 10 seconds, and calls, they "bounced" — but that's a total success. Bounce rate measures a technical behavior, not a business outcome. Since GA4, it's been replaced by "engagement rate," an equally ambiguous metric. Average session duration. A visitor who spends 8 minutes on your site — are they fascinated or lost? Impossible to tell without context. This metric is a classic vanity metric. Pages per session. Same problem. More pages = better engagement? Or confusing navigation? The number alone tells you nothing. Demographic data (age, gender). In many analytics stacks, these data points rely on profiling or advertising features that trigger consent and privacy review. And in the vast majority of cases, they do not change an SMB's business decisions.6. Reading Frequency: The Discipline of Simplicity Running a website shouldn't take more than 15 minutes per week.Weekly: Check your 5 KPIs. Identify one trend and one action. Monthly: Compare this month to last month. Prepare the client report if you're at an agency. Quarterly: Zoom out. Are traffic sources shifting? Are conversions trending up? Should you adjust strategy?The temptation to avoid: checking stats every day. Daily fluctuations are statistical noise. 200 visitors on Monday and 150 on Tuesday means nothing. Only the weekly or monthly trend matters.Conclusion: The Discipline of Simplicity Go back to the fundamentals. Print this list of 5 KPIs, configure your tool to show only these, and ignore the rest. If your current tool can't deliver these 5 answers in under 30 seconds, it might be time for a change. Our analytics tool comparison can help you choose. Analytics shouldn't be a chore. It's a decision tool — and like any good tool, it should be simple to use.FAQ: Essential Metrics Should I track the "Bounce Rate"? No. If a visitor arrives, finds your phone number in 10 seconds, and calls, they "bounced" technically — but it's a business success. Bounce rate doesn't distinguish a satisfied visitor from a disappointed one. Focus on conversions (KPI #5), which measure the actual result. How often should I check my stats? Once a week, 10-15 minutes maximum. Checking every day creates unnecessary anxiety over fluctuations that have no statistical significance. Trends are read over weeks, not days. Are these 5 KPIs enough for e-commerce? For a small e-commerce site (under 500 orders/month), yes. KPI #5 (Conversions) becomes "Number of sales + Revenue." For larger e-commerce with multi-channel attribution needs, you'll want additional metrics (average order value, cart abandonment rate, cost per acquisition by channel). How do I set up conversion tracking without Tag Manager? Most frugal analytics tools offer built-in event tracking: you define a CSS selector (e.g., "click on the .btn-contact button") directly in the interface, with no code or Tag Manager required. Check your tool's documentation for the exact procedure. My boss wants a report with 20 metrics. How do I convince them? Send them the 5 KPI table for 4 weeks, adding a "Recommendation of the Week" line based on these metrics alone. When they realize they make better decisions with 5 metrics than with 20, the debate is over. The ultimate test: ask them to name the 20 metrics from memory. If they can't, they don't need them.
- 05 Jan, 2026
Why the Era of 'Data Obesity' Is Paralyzing Small Businesses (And How to Break Free)
We were sold a dream. The "Big Data" dream. For the past decade, the promise made to SMB owners, SaaS teams, and marketing managers has been the same: "The more data you collect about your visitors, the better you'll sell." The reality in 2025? It's often the opposite. Tools have become bloated, data piles up unread, and decisions are slower than before. This is what we call data obesity: the accumulation of data that doesn't serve decisions, but costs you in time, money, compliance, and performance. In short:Too much data kills decisions: information overload clutters dashboards and paralyzes action. The "Vanity Metrics" trap: you track flattering curves instead of focusing on what actually drives revenue. A triple cost: technical (slower site), legal (GDPR), and trust (visitors refusing tracking). The solution exists: frugal analytics — measure less, decide better.1. The "Dashboard Nobody Looks At" Syndrome Open your current analytics tool. In under 10 seconds, can you tell:whether your week was good? which page generated the most leads? which traffic source is performing best?If the answer is no, you're not alone. You're in the overwhelming majority. Big Data Isn't for SMBs Eurostat's Digitalisation in Europe publication frames advanced digital adoption as a 2030 objective: 75% of EU companies should use cloud computing, perform big data analysis, or use artificial intelligence. The same source shows the gap by company size: in 2022, 98% of large businesses reached a basic level of digital intensity, versus 69% of SMEs. → Source: Eurostat – Digitalisation in Europe, technology uptake in businesses Yet these same SMBs end up with tools designed for 20-person data teams. GA4 offers hundreds of reports, dozens of dimensions, customizable explorations. For a 2-person marketing team, it's like getting an airliner cockpit when all you need is a car dashboard. The Choice That Paralyzes The abundance of options, reports, and dimensions creates user fatigue. This is a well-documented phenomenon in behavioral science: choice overload. The more options you have, the less capable you are of choosing — and the less satisfied you are with your choice when you make one. → Source: The Decision Lab – Choice Overload Bias Applied to analytics: more information ≠ better decisions. On the contrary, too much data leads to inaction. You close the tab and fly blind.2. The Race for "Vanity Metrics" In many small businesses, the metrics sitting at the top of dashboards are also the ones least useful for decision-making:pageviews (without knowing which pages convert), total session count (without distinguishing prospects from bots), bounce rate (an ambiguous metric, often misinterpreted), visitors by country (rarely actionable for a local business).These metrics flatter the ego — "we had 10,000 visits this month!" — but they say nothing about a site's actual performance. The 3-Question Test For a small business, a useful dashboard should answer three questions:How many people are discovering my site? (acquisition) Which pages generate the most inquiries or sales? (performance) What does that represent each week? (results)If your tool can't answer these immediately, it's pulling you away from your main goal: understanding what works so you can grow your business. We've detailed which metrics to keep (and which to ignore) in our guide to The "5 KPIs" Method.3. The Hidden Cost of Complexity Data obesity doesn't just cost time. It has three concrete costs that most businesses underestimate. 3.1 The Technical Cost: A Slower Website Traditional analytics tools often ship heavy scripts that degrade Core Web Vitals — the web performance metrics Google uses as a ranking factor. An independent audit by Bejamas shows that third-party scripts (analytics, chat widgets, marketing pixels) can significantly slow down page loads, with analytics scripts often leading in main-thread blocking time. → Source: Bejamas – How Popular Scripts Slow Down Your Website The GA4 script weighs approximately 45 KB compressed in the cited measurements. Frugal alternatives often sit between 1 and 6 KB. As we explain in our article on SEO without Google Analytics, lighter third-party scripts can contribute to better Core Web Vitals, even though the result always depends on the full page. Slower sites = fewer conversions = less revenue. 3.2 The Legal Cost: GDPR Risk The more signals you collect — precise geolocation, cross-page navigation, technical fingerprinting, per-page session duration — the higher your legal exposure. Every piece of data collected is a piece of data to protect, to document in your processing registry, and to justify during an audit. European Data Protection Authorities — including the French CNIL — describe a narrow path for audience measurement tools that meet strict conditions. The practical lesson is not "no banner by default"; it is that minimal collection, clear documentation, and a correctly configured tool reduce compliance burden. → Source: CNIL – Audience measurement solutions This is probably the most underappreciated argument for frugal analytics: collecting less reduces the surface you need to document and can simplify review. It does not remove the need to assess purposes, visitor information, possible consent requirements, or the other trackers on the same site. For the formal criteria, use the CNIL page and document your own configuration. 3.3 The Trust Cost: Visitors Who Refuse Another side effect of traditional analytics: cookie banners. According to data from European regulators, cookie refusal rates have risen significantly since enforcement began in earnest. Depending on consent rates, browsers, blockers, geography and the broader tracker stack, a classic cookie-banner setup can materially reduce measured traffic. → Source: CNIL – Cookie action plan impact evaluation In some sectors, ad blockers and script blockers amplify the gap further. Result: your dashboard can under-represent part of the measurable audience. The size of that gap is context-specific. A cookieless-by-default tool reduces dependence on acceptance rates for the audience-measurement layer. Your final consent UI still depends on the full tracker stack, including advertising pixels, personalization, or session replay.4. The Solution: Frugal Analytics Frugal analytics isn't about measuring less out of laziness or ideology. It's about measuring better, by focusing on what:concretely helps you make decisions, respects visitor privacy, doesn't slow down your site, limits some legal-review friction.What It Changes in PracticeBefore (Data Obesity) After (Frugal Analytics)200+ metrics available 5-7 actionable KPIsDashboard opened once a month (and closed immediately) Dashboard checked weekly, understood in 30 secondsConsent UI driven by broad tracker stack Cookieless-by-default audience baselineHeavy script, possible Core Web Vitals impact Lighter script, impact to measure in contextComplex GDPR compliance (CMP, registry, proxying) Minimal collection and more readable review40-page monthly report 10-line results-oriented reportFrugal analytics is the equivalent of seasonal cooking: fewer ingredients, better chosen, better prepared. The result is superior to accumulation. The Core PrinciplesCollect only what drives decisions. If a data point wouldn't change your actions, don't collect it. Simplify to democratize. A dashboard the founder understands is worth more than a report only the data analyst can interpret. Respect by design. Compliance shouldn't be a bolt-on ("let's proxy GA4 to reduce risk") but a prerequisite: choose collection boundaries that are clear, minimal and documentable. Measure performance, not people. Aggregated trends (popular pages, traffic sources, conversion rates) are more useful and less risky than individual-level tracking.5. Where to Start If you're convinced your current analytics is too complex, here are the first three steps. Step 1: Identify your 5 KPIs. Use the 5 KPIs method to define the only metrics that matter for your business. If an indicator doesn't pass the test "would I change how I work if this number moved?", remove it. Step 2: Evaluate your current tool. Compare it honestly against the alternatives. Our analytics tool comparison details the strengths, weaknesses, and pricing of each family (GA4, Matomo, frugal). Step 3: Test. Most frugal solutions install quickly with a short script and offer a free trial. Run both tools in parallel for a month. Compare: which one gives you an answer faster?Conclusion: Put Your Analytics on a Diet The era of collecting data "just in case" is behind us. Regulation, web performance, and common sense all converge on the same conclusion: less data, better chosen, is better for everyone — for the business, for visitors, and for the web. For 2026, the best strategy for an SMB isn't adding dashboards — it's removing them. Less noise. Less friction. More concrete decisions. Frugal analytics means putting data in service of the business, not the other way around.FAQ: Understanding Frugal Analytics What is frugal analytics? An approach to audience measurement that limits collection to the strict minimum needed to make business decisions. It's built on three principles: collect only what drives action, prefer aggregated data over individual profiles, and choose tools with clear collection boundaries (no measurement cookies, no user profiles). Which metrics should I absolutely keep? Unique visitors, traffic sources, top pages, key events (CTA clicks, form submissions), and conversions. These 5 metrics are enough to steer a brochure site, a blog, or a small e-commerce store. Everything else is bonus — or noise. Can you do frugal analytics with GA4? Technically yes, but it requires advanced expertise: disabling granular collection, configuring consent mode, reducing some transfer or collection risks, and building custom reports limited to essential KPIs. For most SMBs, it is simpler to choose a natively frugal tool and then document the actual setup. Is frugal analytics enough for e-commerce? For a small e-commerce site (under 1,000 orders/month), yes. The 5 essential KPIs cover acquisition, engagement, and conversion. For e-commerce with multi-channel attribution, retargeting, or advanced segmentation needs, a more comprehensive tool (Matomo, GA4) will be necessary — but the frugality principle still applies: start with the essentials, and add complexity only if it's justified. How many businesses actually use Big Data? Eurostat's Digitalisation in Europe data shows a persistent size gap in digital intensity: in 2022, 98% of large businesses reached a basic level, versus 69% of SMEs. Most small teams do not have the people, tools, or need to exploit massive datasets. Frugal analytics is the approach suited to this reality. SourcesEurostat, Digitalisation in Europe: technology uptake in businesses CNIL, Cookies: audience measurement solutions CNIL, Cookie action plan impact evaluation Google Search Central, Core Web Vitals and Google Search results