Tag: Acquisition
All blog posts with this tag.

- 20 Jul, 2026
Acquisition pages: seven signals to track without building an analytics maze
An acquisition page does not need fifty metrics to be managed well. It needs to answer a short chain of questions:are the right people arriving? do they understand the proposition? do they move toward the intended action? do they complete it? are the resulting leads or sales useful? does the page work properly? is the measurement reliable enough to support a decision?This chain prevents two common mistakes. One is judging a page only by traffic volume. The other is adding behavioural events without connecting them to a business decision. For an SME or B2B SaaS team, seven signals are usually enough for a sound diagnosis. Define the page's job before its metrics Not every acquisition page has the same objective. A page may aim to:generate demo requests; start trials; collect quote requests; sell a product; deliver a resource; register attendees; move visitors to pricing; qualify a need before a sales conversation.Its primary KPI follows from that job. An educational content page should not be judged like a demo page. An awareness campaign should not be read like high-intent search. Document four elements first:Element QuestionAudience Who is the page for?Promise Which specific problem does it solve?Source Which channel or campaign brings visitors?Action What useful action should follow the visit?This short brief becomes the reference point when the numbers change. Signal 1: qualified entries by source The first signal is not raw session volume. It is the distribution of entries by source, campaign and intent. Two hundred visits from a precise query may be more useful than two thousand loosely targeted visits. Conversely, low volume does not prove quality if none of the visitors belong to the intended segment. Review at least:visits or sessions starting on the page; source and medium; campaign; identified ad or link content; organic query where Search Console provides it; country or commercial region when genuinely relevant; direct traffic, interpreted cautiously.GA4's Landing page report associates the first pageview in a session with metrics such as sessions and key events. It can also use Session source / medium as a secondary dimension. Search Console complements this view for Google Search with clicks, impressions, CTR, position, queries and pages. The tools do not measure the same thing. Search Console describes visibility and clicks in Google results. Analytics describes activity observed after arrival, within its collection limits. Their totals should not be expected to match visitor by visitor. For campaigns, a stable UTM convention matters more than a sophisticated dashboard. Our guide to UTMs, referrers and direct traffic explains how inconsistent labels fragment reports. Signal 1: Decision question Is the page attracting the audience its message was designed for? Signal 2: intent-to-message fit A page can receive relevant traffic and still fail because its promise does not match the reason behind the click. Compare:the ad copy; the keyword or query; the newsletter link; the visible headline; the supporting proof; the requested action.Someone clicking “compare analytics tools for multiple websites” should encounter that topic immediately. Opening with generic digital-transformation language creates a gap even when the design is polished. No single rate captures this signal. Use several clues:conversion by source or campaign; primary CTA clicks; movement toward the expected section; very fast exits, interpreted cautiously; feedback from sales or support; focused user tests.Engagement time can flag an anomaly, but it is not proof of interest. A long duration may mean close reading or confusion. A short duration may mean abandonment or an immediate answer. Signal 2: Decision question Does the visitor clearly find the promise that brought them to the page? Signal 3: primary call-to-action activity The primary CTA is the first observable commitment toward the objective. Track an action that matters, such as:clicking Request a demo; opening a form; moving to pricing; adding to cart; starting a trial; confirming a download; scheduling a meeting.Do not label every click as a conversion. Accordion opens, tab clicks and scroll depth can support diagnosis, but they do not carry the same intent as a commercial action. A useful measurement sequence is usually:page entry; primary CTA click; form or flow start; successful completion.This separates a messaging weakness from a form problem. If few visitors click, investigate what happens before the CTA. If many click but few finish, inspect the next step. A minimal analytics tracking plan helps keep those definitions stable. Signal 3: Decision question Does a sufficient share of qualified visitors choose to continue? Signal 4: conversion completion The final conversion is the action the business considers useful. It must be unambiguous. Examples include:an accepted form submission; a confirmed appointment; an account creation; a completed payment; an activated trial; a delivered download.Always name the denominator. “Eight per cent conversion” is meaningless without knowing whether it refers to visitors, sessions, form opens or CTA clicks. For a form, measure at least:opens; starts; errors; abandonment; successful completion.Do not send field values to analytics. Form content may contain names, email addresses, phone numbers, free text and other personal data. The business system needs the content. Analytics usually only needs a technical or functional status. Signal 4: Decision question Where does the journey lose people who already expressed intent? Signal 5: post-conversion quality A page can achieve a strong conversion rate and create poor commercial outcomes. For B2B teams, the decisive signal often appears after the form:fit with the target profile; a request genuinely related to the product; an attended meeting; an opportunity created; continued sales progression; revenue or value created; spam and off-target demand.Connect acquisition to the CRM with proportionate granularity. You do not always need to send personal CRM data back into analytics. An aggregate table by campaign, source or landing page may be enough to answer which entries produce useful demand. Agree on a short sales classification:qualified; unqualified; duplicate; spam; outside market; no next step; opportunity.This prevents marketing from optimizing only for form volume. Signal 5: Decision question Does the page create useful outcomes rather than submissions alone? Signal 6: technical performance and errors A slow or unstable page can damage the experience before the message is evaluated. Core Web Vitals provide three field indicators:LCP for main-content loading; INP for interaction responsiveness; CLS for visual stability.Complement them with operational checks:JavaScript errors; forms that cannot submit; blocked resources; mobile CTAs hidden by layout; incorrect redirects; a 404 after submission; missing or duplicated tracking; consent logic applied incorrectly; abnormal server response time.Do not confuse correlation with causation. A technical improvement may accompany a conversion increase without being its only cause. Use performance data to identify differences by device, release and period. Signal 6: Decision question Is a technical constraint preventing part of the audience from progressing? Signal 7: measurement health The seventh signal concerns the data itself. Before interpreting a change, verify:event volume relative to visits; duplicated tags; consent changes; missing or inconsistent campaign parameters; redirects that lose parameters; sensitive values in URLs; form changes; releases during the period; time-zone differences; internal filters and exclusions.A 30 per cent increase may come from a successful campaign, a duplicated event or a changed definition. Document measurement changes before assigning a business cause. Our guide to privacy-first URL parameter filtering helps prevent identifiers and sensitive values from entering reports. Signal 7: Decision question Does the observed change describe the market, or a change in the measurement system? A minimal dashboard A landing-page dashboard can use this structure:Block Primary measure Useful breakdownAudience Qualified entries Source, campaign, deviceMessage CTA clicks / entries Source, variantJourney Starts and completions Step, deviceOutcome Useful conversions Campaign, segmentQuality Qualified leads Source, pageTechnical Vitals and errors Device, releaseMeasurement Documented anomalies Date, deploymentLimit comparisons to segments that can lead to action. A filter that changes no decision adds complexity without improving control. Review cadence Weekly Check:traffic breaks; form errors; misattributed campaigns; extreme changes; mobile problems; performance incidents.Monthly Review:source quality; conversion trends; lead quality; pages and campaigns to improve; tested hypotheses; decisions made.Put the conclusion into the monthly web report rather than sending a separate export from each tool. Metrics not to over-interpret Bounce rate Its definition varies by tool and context. A short visit to a page that answers a question immediately is not necessarily a failure. Scroll depth It may show how far content was traversed, but not what was understood. It is useful for comparing variants, not for proving intent. Time on page It combines attention, confusion, abandoned tabs and measurement constraints. Heatmaps They can help form a hypothesis, but they do not replace conversion data or user research. They also involve more detailed collection that should be assessed separately. Click volume It only matters when the action matches an explicit objective and the event is not emitted more than once. Conclusion An acquisition page should be managed as a chain, not as a ranking of metrics. The seven useful signals are:qualified entries; intent-to-message fit; CTA activity; conversion completion; post-conversion quality; technical performance; measurement health.Start with this structure. Add a metric only when it answers a question the team is prepared to act on. FAQ What is the primary KPI for a landing page? It is the useful action defined for that page: a qualified request, trial, purchase, meeting or another explicit result. Traffic and engagement mostly explain that result. Should scroll depth be measured? Only when it tests a specific hypothesis, such as whether an important proof point is rarely reached. Scroll should not be treated as a conversion. Why do GA4 and Search Console show different figures? They measure different stages and scopes. Search Console measures appearances and clicks in Google Search. GA4 measures sessions or events observed on the site, according to its setup and consent choices. How can a landing page be connected to revenue? Preserve source, campaign and landing-page context in the CRM or a controlled attribution table, then analyse aggregate cohorts. Avoid sending unnecessary personal CRM data back to analytics. How many events should be tracked? For most B2B pages, four levels are enough: entry, CTA click, journey start and success. Add diagnostic events only when they address a known problem. Sources Sources checked on June 21, 2026.Google Analytics, Landing page report Google Search Console, Performance report web.dev, Web Vitals Google Analytics, collect campaign data with custom URLs CNIL, cookies and other trackers
- 25 May, 2026
UTM tags, referrers and direct traffic: read acquisition sources correctly
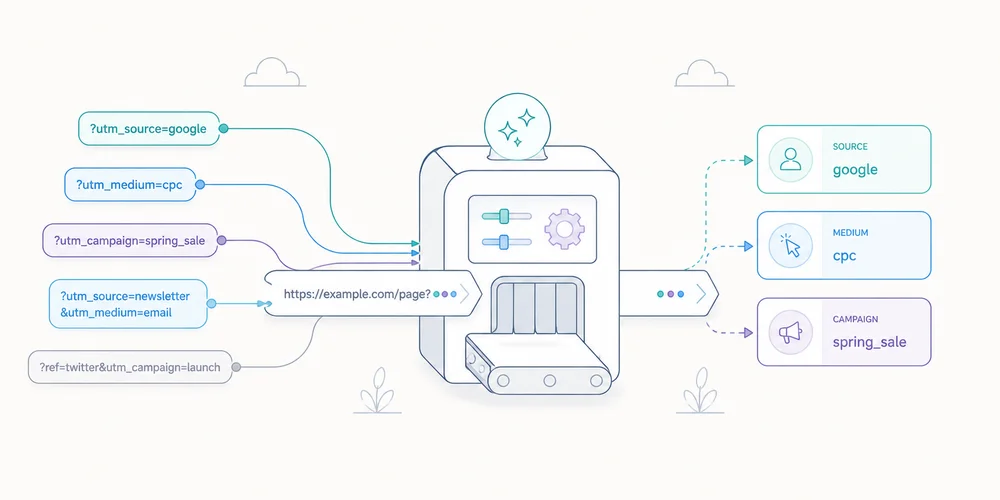
A rise in direct traffic does not necessarily mean more people typed your domain into a browser. A UTM-tagged visit does not prove that one campaign created the demand. A missing referrer does not prove that the visit had no source. These concepts appear in the same acquisition reports but describe different signals:UTM parameters are labels deliberately added to a URL; the referrer is information a browser may transmit; direct traffic is a classification used when the analytics system has no more specific usable source under its rules.Reliable reporting starts with that distinction. It also accepts that web attribution is a reconstruction from incomplete signals, not a complete history of a person's journey. UTM tags are declarations attached to a link A campaign URL might look like this: https://www.example.com/guide/?utm_source=newsletter&utm_medium=email&utm_campaign=launch_juneCommon parameters are:utm_source: the declared origin, such as linkedin, newsletter or a partner; utm_medium: the channel family, such as paid_social, email or referral; utm_campaign: the initiative name; utm_content: a creative, placement or link variant; utm_term: historically used for keywords, and best used only when there is a clear need.Google documents additional manual campaign parameters, but most small teams gain little from more dimensions. Three required fields and one optional variant are usually enough. UTM values are not detected by the browser. A person or system writes them into the link. Treat them as declared campaign metadata, with the strengths and weaknesses of any declared data. What UTM tags do well They help when the referrer is missing, generic or insufficient:newsletters; QR codes; PDF documents; email signatures; organic or paid social posts; partner campaigns; in-app links.They also distinguish two links to the same destination, such as a newsletter hero button and footer link. What they do not prove A UTM tag does not prove that the campaign caused all demand. It says that the measured visit arrived with that label. The URL may have been copied into a private channel, forwarded by a colleague, opened much later or altered by an intermediary. The visitor may have discovered the brand elsewhere first. Reports should therefore describe visits and conversions attributed under the measurement rule, not certain causality. The referrer is conditional browser information When a browser follows a link, it may send the HTTP Referer header to the destination. The historical misspelling remains part of the protocol. What is sent depends on referrer policy, protocol, browser, opening context and the source site's choices. The modern default policy, strict-origin-when-cross-origin, generally sends:the full URL for same-origin navigation; only the origin for HTTPS cross-origin navigation; no referrer when moving from HTTPS to HTTP.A site can apply a stricter policy, an app can open a webview, and redirects or privacy protections can remove the signal. Referrers are useful but never guaranteed. Referrer and UTM can coexist A visit may provide:referrer: linkedin.com; utm_source: linkedin; utm_medium: paid_social; utm_campaign: webinar_june.The analytics platform then applies its own precedence rules. GA4 exposes manual source, medium and campaign dimensions while channel groups follow documented rules that can evolve. Do not compare reports without checking scope. First-user source, session source and key-event attribution answer different questions. Direct means that no better source was assigned In everyday language, “direct” suggests a typed URL or bookmark. Those visits exist, but the channel can also contain visits whose source was lost. Common examples include:untagged links in mobile apps or messaging tools; local documents, PDFs and presentations; redirects that drop parameters; restrictive referrer policies; secure-to-insecure navigation; email campaigns without UTM tags; copied links shared in private channels; analytics deployment errors; URL cleanup before campaign parameters are read.A safer interpretation is:The platform did not assign this visit to a more specific source with the data available.A large direct share is not automatically a problem. It becomes an audit signal when it changes abruptly, concentrates on a campaign landing page, or differs unexpectedly between tools measuring the same scope. Build a controlled UTM taxonomy The main risk is not a missing tag. It is inconsistent naming that fragments reports. 1. Use a closed vocabulary for utm_medium The medium should represent a channel family. Keep a controlled list, for example: email paid_search paid_social organic_social partner affiliate display offlineDo not mix paid-social, paidsocial, cpc_social and social_paid. Platforms may treat case and spelling variants differently, and reports will often show separate rows. 2. Use source for a platform or partner Examples: linkedin google customer_newsletter partner_acme event_parisDo not put the campaign name in the source, or you lose the ability to compare the same source over time. 3. Give campaigns a readable structure A simple convention is: goal_offer_periodExamples: lead_demo_2026q2 launch_product_2026june retention_webinar_2026q3Choose one language, case and separator. Lowercase with underscores is easy to validate. 4. Reserve utm_content for useful variants Examples include:hero_button; footer_link; video_a; creative_02; partner_banner.Never use it for recipient information. 5. Centralise link generation A validated spreadsheet, small internal generator or controlled form removes most variants. Store destination URL, source, medium, campaign, optional content, owner, creation date and status. Never place personal data in UTM tags Query parameters spread across many systems. They may appear in:browser history; web-server and CDN logs; analytics tools; support tools; screenshots; copied links; some referrer data; exports and reports.Do not put an email address, name, phone number, customer ID, token or other person-level identifier in a UTM value. For example: utm_content=customer_12345 utm_campaign=renewal_alice@example.comThese values turn campaign metadata into a personal-data distribution channel. Use a category or creative variant, not a person. Your data collection summary should state which parameters are allowed, retained or removed. Five mistakes that distort reporting Using UTM tags on internal links Internal UTM tags can create new attribution or overwrite prior context depending on the platform. Use an event or internal dimension to compare navigation placements. Tagging everything without a question A tag is unnecessary when the referrer provides enough information and no variant needs to be separated. Campaign metadata should answer a decision, not simply add columns. Changing convention mid-campaign linkedin, LinkedIn and linkedin.com can become three rows. Correct naming at generation time and keep a change log. Cleaning the URL too early Removing visible parameters after capture can produce a cleaner address. Removing them before analytics reads them loses the campaign. Test execution order. Comparing tools without aligning definitions Platforms can differ in session definitions, attribution windows, source lists and precedence rules. A discrepancy is not automatic proof that one tool is broken. Diagnose a rise in direct traffic 1. Locate the change Inspect landing pages, devices, countries and time patterns. A home-page increase differs from a spike on a campaign-only page. 2. Review deployments Look for changes to redirects, routing, CMP behaviour, tag managers, analytics scripts or URL cleanup. 3. Audit live campaign links Open the actual links in emails, ads, profiles, QR codes and documents. Do not rely on the planning sheet. 4. Test the complete journey Follow the link in its real context: app, messenger, embedded browser, PDF or QR code. Inspect the collection request and final report. 5. Accept residual uncertainty Dark social and no-referrer contexts cannot be reconstructed with certainty without more intrusive tracking. Responsible analytics sometimes keeps an unknown bucket rather than manufacturing false precision. A minimal acquisition dashboard For a small B2B team, four views are often enough:visits by source and medium; landing pages by source; meaningful conversions by source; direct and unassigned trends.Add cost and revenue only when definitions and joins are reliable. An apparently precise ROAS built on incomplete identifiers may be less useful than a well-defined cost per qualified request. Review trends over several weeks. Low volumes make daily changes noisy. Conclusion UTM tags, referrers and direct traffic are not three versions of the same field. They are separate mechanisms that complement and sometimes contradict one another. A sound acquisition setup uses:a short, controlled UTM taxonomy; no personal identifiers in URLs; a realistic view of referrer limits; a cautious definition of direct; documented attribution rules; regular checks of the links actually distributed.The goal is not to eliminate all direct traffic. It is to make important campaigns readable without pretending to reconstruct every journey. FAQ What is the difference between utm_source and the referrer? utm_source is deliberately added to a link. The referrer is a signal the browser may send from the previous page. Either, both or neither may be present. Does direct traffic mean people already know the brand? Sometimes, but not exclusively. It also includes visits for which no usable source was assigned, including some apps, documents and untagged campaigns. Which UTM parameters are essential? For most teams, utm_source, utm_medium and utm_campaign are the baseline. Use utm_content for a meaningful variant and add other parameters only for a defined question. Should internal links use UTM tags? Usually not. They can disrupt attribution. Use dedicated events or dimensions for internal navigation. Can UTM parameters be removed after arrival? Yes, once they have been captured correctly. Test execution order and retain the values only according to your collection and retention policy. SourcesGoogle Analytics, Traffic-source dimensions, manual tagging and auto-tagging Google Analytics, Default channel group definitions MDN, Referer header MDN, Referrer-Policy header OWASP, Information exposure through query strings in URL CNIL, The six GDPR principles
- 27 Apr, 2026
AI assistant traffic is not just direct traffic: how to measure ChatGPT, Perplexity, and Claude without fooling yourself
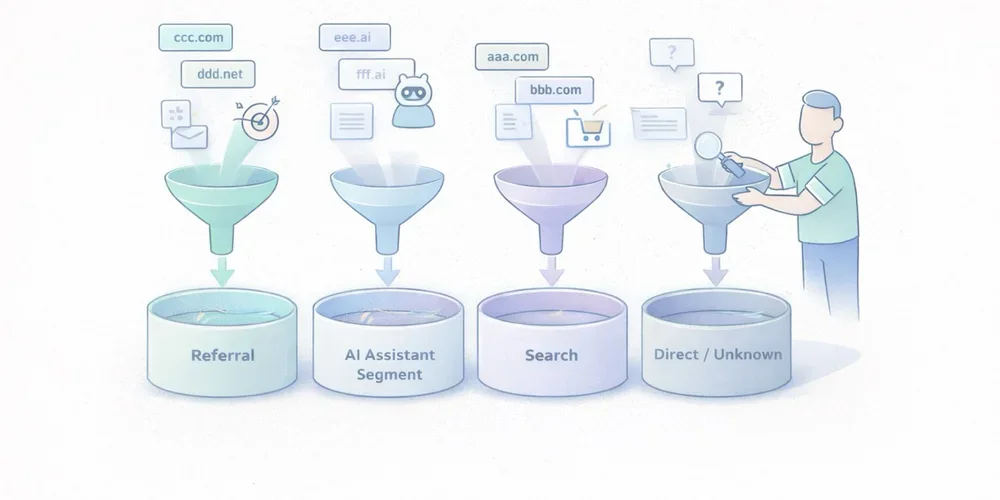
Over the last few months, more marketing teams have started asking the same question: “Are we getting AI traffic now?” The question is fair. ChatGPT, Perplexity, Claude, and other interfaces now show links to websites more often. Some teams can already see those visits in their dashboards. Others notice direct traffic going up and jump to the conclusion that “AI tools are sending direct traffic.” That reading mixes together several very different realities. Some traffic from AI assistants is measurable as normal referral traffic. Some of it ends up in direct or unknown because no usable referrer is passed along. Another part never appears in your analytics at all because there was no click. And when Google blends AI experiences into Search, the line gets even blurrier. In other words, AI traffic is neither a perfectly clean new channel nor a pure illusion. It is a mixed set of behaviors that needs to be read carefully. The goal is not to measure everything perfectly. The goal is simpler and more useful: separate what is truly attributable, document the gray area, and avoid building a story on top of fragile numbers. AI traffic is not one technical source The first thing to clarify is simple: “AI traffic” is not a single analytics category. In practice, teams usually mix together at least four different cases. 1. Assistants that send a real referrer Some ChatGPT, Perplexity, or Claude experiences show links to web sources. When a user clicks from an interface that passes usable source information, your analytics tool may see a referring domain. This is the easiest part to measure. It behaves like regular referral traffic:a visit arrives with an identifiable source domain; a landing page is viewed; the visitor may convert, bounce, or continue browsing.This case alone is enough to justify a dedicated segment. Plausible, for example, documented a strong increase in referral traffic from ChatGPT, Perplexity, Claude, and Phind in 2024. That is not a universal benchmark, but it is a useful signal: AI assistants can send visible, usable traffic. 2. Assistants or apps that do not pass clean source data Not every click is passed through cleanly. Fathom’s documentation explicitly notes that “Direct/unknown” traffic can come from direct visits, email, apps, or any situation where no referrer was passed, and that no analytics platform can control this. This is where many teams get the story wrong. A rise in direct traffic does not prove that AI assistants caused it. But the reverse is also true: some traffic from AI assistants may get absorbed into direct or unknown if the technical context does not pass usable source information. 3. AI answers that cite you without sending a click This is a critical point. Your content can be cited, summarized, or used as a source in an assistant answer without producing a visit to your site. When that happens, your web analytics sees nothing. You may have gained visibility. You did not gain a session. Treating those two things as the same will quickly distort your analysis. 4. AI experiences embedded inside traditional search Google is a special case. Google presents AI Overviews and AI Mode as Search features that can show links to websites and that do not require separate SEO tactics beyond the usual fundamentals. For measurement, that means something straightforward: anything driven by AI will not necessarily appear as a cleanly separated channel, especially when the experience remains embedded in an existing search environment. So avoid overly binary logic such as:“standalone assistant = AI traffic”; “search engine = standard SEO traffic.”In reality, the line is becoming more porous. What you can actually measure today The good news is that you can already measure several useful things without building an oversized setup. Visible referring domains This is the foundation. If your analytics tool exposes referrers or sources, you can identify visits attributed to domains tied to AI assistants. Depending on your stack, that may happen through:a Referrers report; a Sources report; a custom segment; a dedicated channel group.Google Analytics 4 even includes an explicit example of a custom channel group called “AI assistants,” with matching rules for assistants such as ChatGPT, Gemini, Copilot, Claude, and Perplexity. That matters. It shows that in 2026, even Google Analytics treats this as a real analysis use case, not a niche curiosity. Landing pages that capture those visits Volume alone is rarely helpful. The more useful question is: which pages attract this traffic? If three articles, two product pages, and one comparison page capture most visits from AI assistants, you already have a practical reading:which assets are being cited or surfaced; which topics are emerging; which pages function as entry points; which pages deserve improvement.That is often more useful than a single session count. Conversions and intent signals If your tool tracks goals or events, you can go further:demo requests; newsletter signups; meetings booked; trial starts; purchases; clicks on pricing or strategic CTAs.At that point, you are no longer just measuring curiosity. You are measuring traffic quality. That is where an “AI assistants” segment becomes valuable. Not because it sounds trendy, but because it lets you compare:volume; engagement rate; visit depth; conversion.UTM campaigns when you control distribution yourself There is also a simpler case: links that you distribute. If you publish something in a newsletter, a document, a partnership page, or a directory, and you want to observe how your own distribution performs, UTM parameters remain useful. But do not assume AI assistants will preserve your tracking conventions in every context. UTM tags are excellent for measuring links you intentionally distribute. They are much less reliable for mapping every citation or click generated by third-party AI systems. What you will not measure cleanly This is often the most important part of the conversation. Good measurement also means accepting limits. You will not see mentions without clicks If an assistant summarizes your content, uses your ideas, or cites your page without sending a visit, your web analytics will remain silent. That does not mean your content had no role. It just means web session data is not the right sensor for that kind of visibility. You will not always separate AI traffic from direct traffic When a visit arrives without a usable referrer, you enter a gray zone. That gray zone may include:real direct traffic; email traffic; messaging apps; app traffic; browsers or contexts that strip source data; potentially some traffic originating from AI assistants.The only serious posture is to treat that as uncertainty, not as a hidden truth waiting to be renamed. You will not perfectly isolate AI-powered search experiences When an AI experience remains embedded inside an existing search environment, isolated attribution becomes harder. Google explains its AI features in Search as part of the broader web search experience, with the same core SEO fundamentals still applying. For marketing teams, the practical implication is simple: not every visit influenced by AI will appear as a distinct AI source in your reports. You should not confuse citation, visit, and revenue Being cited in an assistant, receiving a click, getting an engaged session, and generating a conversion are four different things. A useful dashboard needs to keep those levels separate. Otherwise, it becomes very easy to move from a modest observation, “we are seeing some visits from ChatGPT and Perplexity,” to a much bigger story, “AI is becoming our next major acquisition channel.” The cleanest way to measure this traffic The goal is not to build a perfect system. The goal is to create a simple, stable, reusable reading framework. 1. Create a dedicated AI assistant segment or channel Start with a short list of sources you can actually observe. For example:ChatGPT / OpenAI; Perplexity; Claude / Anthropic; optionally Copilot or Gemini if they are already visible in your data.Be conservative. Do not add ten hypothetical domains that never show up. 2. Analyze landing pages first Before commenting on volume, look at:which pages receive those visits; whether those pages are old or recent; whether they answer comparative, practical, or explanatory queries; whether they work well as entry pages.This is often where the useful insight lives. 3. Compare traffic quality, not just traffic size Low-volume but high-intent traffic can matter much more than a visible but shallow spike. At a minimum, compare:whatever engagement metric your tool provides; visit depth; key conversions; CTA clicks; exit pages.4. Keep an eye on direct or unknown as a separate gray zone You should not merge direct traffic into AI traffic. But ignoring it completely would also be naive. The better approach is to document it as a possible gray zone. If visible AI referrers increase and direct traffic rises on the same landing pages, that may support a hypothesis. It is still not proof. 5. Document your reading rules This small step makes a big difference in teams. Write down:which domains are included in the AI segment; what is not measured; what falls into direct or unknown; which conversions are tracked; how often the segment is reviewed.A good dashboard is not enough on its own. You also need an interpretation rulebook. The most common mistakes Calling every direct traffic increase “AI traffic” This is probably the most common mistake. Direct traffic is an imperfect bucket. It can contain many things. Assigning it a single cause without evidence weakens the entire analysis. Creating an overly broad AI channel from day one If you group together any domain that vaguely sounds AI-related, you create a noisy segment. A narrower but cleaner segment is usually more useful than a wide and doubtful one. Focusing on volume before conversion Getting 500 weak visits from an AI interface matters less than getting 30 visits to a comparison page that converts. Mixing classic SEO, AI assistants, and branded traffic without a method The right move is not to force a false opposition. It is to separate what is observable, what is comparable, and what remains hypothetical. What to remember Traffic from AI assistants is real. It is not imaginary. But it also does not arrive as a single, clean, perfectly attributable source. Some of it appears as visible referral traffic. Some of it gets lost in direct or unknown. Some of it never generates a session because no click happens. And some of it lives inside search environments where AI and classic search are harder to separate. The best working approach comes down to four simple rules:isolate the referrers you can actually see; measure landing pages and conversions, not just sessions; treat direct as a gray zone, not as hidden certainty; clearly document what your AI segment includes, and what it does not.That framework is less dramatic than a promise of total attribution. It is also much more useful. FAQ Should traffic from ChatGPT always be classified as direct traffic? No. When a usable referrer is passed, it can be measured as referral traffic or grouped into a dedicated segment. But some visits may still end up as direct or unknown depending on the technical context. Can I measure citations without clicks from AI assistants? Not with standard web analytics. Without a session or a click, your audience analytics tool sees nothing. Should I create a separate AI channel in GA4? Yes, if you are starting to see referring domains tied to AI assistants. GA4 documentation explicitly includes this use case in its custom channel group guidance. Should AI traffic be treated as a major new acquisition channel right away? Not automatically. First look at landing pages, traffic quality, and conversions before making that leap. Can I perfectly separate classic Google Search from Google’s AI experiences? Not always. When AI is embedded inside a broader search experience, isolated attribution becomes harder. SourcesOpenAI Help Center, ChatGPT search : https://help.openai.com/en/articles/9237897-chatgpt-search Claude Help Center, Using Research on Claude : https://support.claude.com/en/articles/11088861-using-research-on-claude Perplexity Help Center, How does Perplexity work? : https://www.perplexity.ai/help-center/en/articles/10352895-how-does-perplexity-work Google Analytics Help, Custom channel groups : https://support.google.com/analytics/answer/13051316 Google Search Central, AI features and your website : https://developers.google.com/search/docs/appearance/ai-features Fathom Analytics Docs, Dashboard explained : https://usefathom.com/docs/start/dashboard Plausible Analytics, Breaking down our AI traffic surge : https://plausible.io/blog/ai-referral-traffic-and-optimization
- 09 Feb, 2026
Why trust is becoming a growth constraint, not a privacy slogan
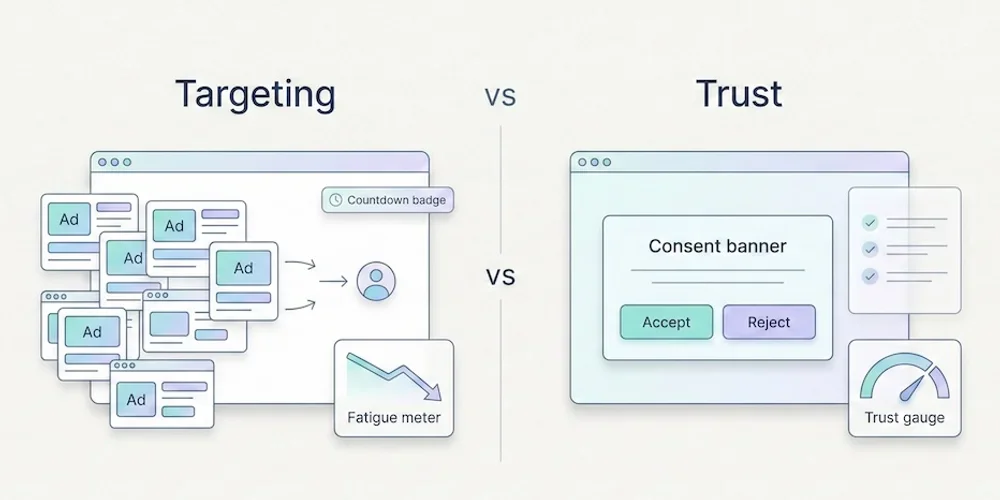
Privacy-first marketing should not be sold as a moral badge or a guaranteed conversion lift. The stronger argument is more pragmatic: trust is becoming part of the buying experience, and intrusive data practices can create friction that teams do not always measure. For European SMEs, B2B SaaS teams and agencies, this matters because growth depends on repeated interactions. A buyer may discover you through content, compare you over several visits, ask colleagues, read docs and return later. If every interaction feels extractive, the relationship weakens before sales even starts. What trust changes operationally Trust does not mean collecting no data. It means collecting data with a clear purpose, explaining it plainly and avoiding silent escalation from measurement to targeting. In practice, trust changes five workflows:analytics: measure what the team actually uses; forms: ask only for fields needed at that stage; advertising: separate measurement from retargeting; content: answer real buyer questions instead of hiding value behind gates; reporting: explain limits instead of pretending every number is perfect.Why targeting can become expensive Targeting can be useful when it is transparent, proportionate and aligned with user expectations. It becomes expensive when it drives:consent friction; duplicated tags; heavier pages; lower trust in forms and demos; noisy attribution debates; extra legal and vendor review.These costs rarely appear in ad-platform dashboards. They show up as longer sales cycles, more implementation work and weaker confidence in the numbers. A practical trust checklist Before adding a new tracking or targeting feature, ask:What decision will this data support? Can we answer the same question with less data? Will the visitor understand why this happens? Does this belong in baseline analytics or an explicit enriched setup? Who will review whether the data is still useful in three months?If the team cannot answer, delay the feature. Where Pomelo fits Pomelo should not promise that privacy-first automatically increases conversion. It should promise a better operating model: cookieless by default, minimal collection, Strict first, Extended by configuration, and reporting that makes data limits visible. That is enough. Teams do not need another vague trust slogan. They need a product that helps them govern measurement choices without slowing down every launch. SourcesCisco, 2025 Data Privacy Benchmark Study, April 2, 2025: https://investor.cisco.com/news/news-details/2025/Ciscos-2025-Data-Privacy-Benchmark-Study-Privacy-landscape-grows-increasingly-complex-in-the-age-of-AI/default.aspx Cisco, 2025 Data Privacy Benchmark Study PDF: https://www.cisco.com/c/dam/en_us/about/doing_business/trust-center/docs/cisco-privacy-benchmark-study-2025.pdf Edelman, 2025 Trust Barometer: https://www.edelman.com/trust/2025/trust-barometer Edelman, 2025 Brand Trust special report: https://www.edelman.com/trust/trust-barometer