Tag: Measure right
All blog posts with this tag.
- 10 Nov, 2026
Google Analytics alternative: when a lighter GA4 replacement makes sense (2026)
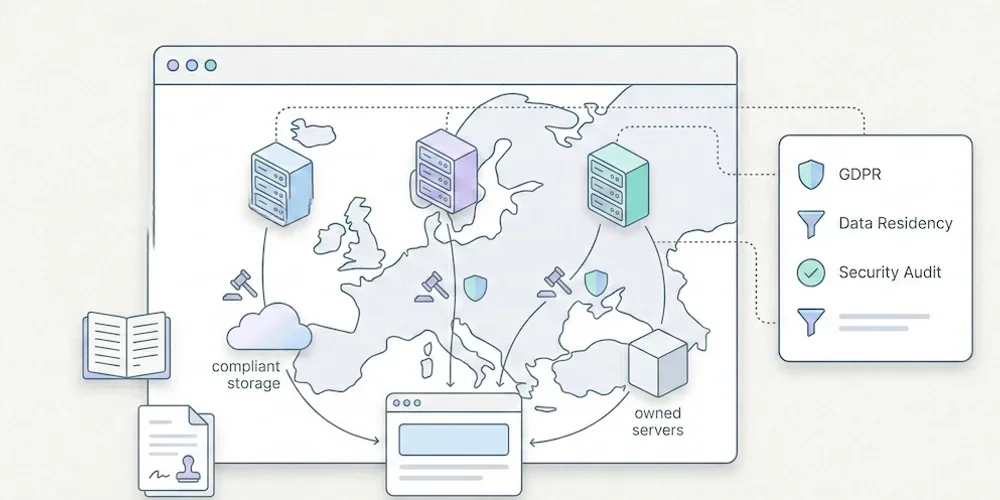
A Google Analytics alternative makes sense when GA4 gives you far more than you use and costs you more than you expected: setup time, consent management, reports nobody reads. It does not make sense for everyone. If your team lives inside Google Ads, builds audiences from behavioral data or has analysts who rely on deep exploration, GA4 remains a serious tool, and it is free at standard level. This article helps you decide which side you are on, and how to move if you leave. The short version Leave GA4 if you run a handful of sites, your team reads five or six numbers a month, and the main friction is configuration, consent handling and a dashboard that is hard to share. Stay on GA4 if paid acquisition on Google Ads is central, you need cross-channel audiences, or you already have a working tracking plan and analysts who use it. Run both for a while if you are unsure. A lighter tool next to GA4 for a month shows quickly which numbers your team actually uses. Why teams look for a GA4 alternativeComplexity. GA4 is event-based and flexible, but a simple question such as "which pages bring qualified visits?" often needs custom exploration. Privacy and transfers. In 2022 the CNIL, the French data protection authority, found that using Google Analytics could involve transfers of data to the United States without sufficient safeguards, and issued formal notices to site operators. The legal context has evolved since, so check the current position with your data protection contact rather than relying on a single decision. Consent dependence. GA4 sets identifiers, so measurement typically depends on consent, and refusals leave gaps in the data. Reporting habits. Many small teams export GA4 data to spreadsheets just to get a readable monthly report.Comparison tableCriterion GA4 Lightweight privacy-first tools (in general) Pomelo AnalyticsPrice model Free standard tier; paid tier for large enterprises Usually paid subscriptions by volume, some free entry plans Free, Starter and Pro plans (see below)Depth of analysis Very deep: explorations, audiences, funnels Focused: pages, sources, goals, events Direct reading: pages, sources, actions, goals, performanceGoogle Ads integration Native Limited or none None; not an advertising toolCollection model Cookies and identifiers by default Often cookieless No measurement cookie, no cross-site tracking, aggregated statisticsConsent dependence Typically depends on consent Varies by tool and configuration Audience measurement designed around regulators’ criteria; the Campaigns option requires consentMulti-site, multi-user Accounts and properties, steep learning curve Varies Several sites in one workspace, 1 member on Free, 3 included on Starter, unlimited on ProSelf-hosting No Some tools offer it Hosted for you in Europe (AWS Stockholm)Migration checklistList the questions you answer today. Keep the ten reports someone opened in the last quarter. Drop the rest. Write a minimal tracking plan. Pages, sources, three to five key events, and a naming convention. Our analytics migration checklist goes into detail. Standardize UTM parameters before switching, so sources stay comparable. Accept the history break. Event definitions and session logic differ between tools. Export the GA4 reports you need for year-over-year comparisons and archive them. Check what you lose. Audiences, Google Ads conversion imports, BigQuery exports and Search Console-style integrations may not carry over. Run both in parallel for two to four weeks. Expect different numbers; compare trends, not absolutes. Update your privacy notice and consent setup once you know what remains on the site. Other trackers on your pages still affect the analysis. Retrain reporting habits. Share one dashboard link instead of a monthly spreadsheet.If Matomo is on your shortlist, see our Matomo alternative guide and the broader GA, Matomo or lightweight analytics guide. For the SEO side of the decision, read do you need Google Analytics for SEO. To understand consent in this context, see the CNIL audience measurement framework. Why Pomelo Analytics If you leave GA4 for clarity rather than depth, Pomelo Analytics, the tool we build, is designed for you. Its idea is simple: measure right. Not more data, but numbers you can trust and read at a glance.Numbers you can trust. Every key metric is explained in the interface. Counts are exact; from 1 to 9 visits, Pomelo shows "< 10" rather than false precision, and an unknown value never appears as zero. A fair collection. Audience measurement with no measurement cookie and no cross-site tracking: the IP address is not kept in measurement data, and statistics are aggregated. The Campaigns option adds channels, UTM and conversions by source, with your visitors’ consent. All your sites in one view. One workspace for every site, with the right people and the right access. A fair price. Plans follow your scale (sites, events, members, history), starting with a free plan. Data hosted in Europe, on AWS Stockholm.Pomelo is built for European SMBs, B2B SaaS and digital teams that run several sites together. Access opens gradually: join the Pomelo Analytics waitlist. Sources Links checked on November 10, 2026.CNIL, Google Analytics and data transfers to the United States: formal notice (February 2022) CNIL, cookies: solutions for audience measurement tools Google Analytics Help Center
- 10 Nov, 2026
Matomo alternative: when a lighter tool beats a full analytics suite (2026)
Matomo is a mature, open-source analytics suite, and for many teams it is the right answer. A Matomo alternative only makes sense if the suite is bigger than your needs: too many reports, a setup that eats engineering time, or hosting you would rather not run yourself. This article also covers the common "Matomo vs Google Analytics" question, since many teams ask it at the same time. The short version Stay on Matomo if you want open source, self-hosting, plugins, a tag manager and deep control over data and configuration, and you have someone to maintain it. Look at a lighter tool if you manage several small sites, nobody wants to administer servers or plugins, and your team reads a short list of numbers every month. Matomo vs Google Analytics: Matomo gives you data ownership and self-hosting, with a more traditional reporting model. GA4 is free at standard level, deeply integrated with Google Ads and strong on exploration, but heavier to configure and tied to Google's ecosystem. Neither is lightweight. Why teams look at alternatives to MatomoOperational weight. Self-hosting means servers, updates, backups and performance tuning. The cloud edition removes that, at a subscription cost that depends on volume and options. Breadth. Matomo covers a lot. If you use ten percent of it, the interface and configuration can feel like overhead. Plugins and premium features. Part of the ecosystem is paid, so the real cost depends on what you install. Consent setup. Matomo documents configuration options that reduce what is collected, but the outcome still depends on how you configure it, the features you enable and other trackers on your site.None of this is a flaw. It is the price of a flexible suite. Comparison tableCriterion Matomo Google Analytics 4 Lightweight privacy-first tools (in general) Pomelo AnalyticsModel Open source; self-hosted or cloud Free standard tier; Google-hosted Mostly paid SaaS, some free plans Hosted SaaS with Free, Starter, ProDepth Very broad: reports, funnels, plugins, tag manager Very deep explorations and audiences Focused core reports Pages, sources, actions, goals, performance, many websitesSelf-hosting Yes No Some tools Hosted for you in Europe (AWS Stockholm)Setup effort Moderate to high High Low LowCollection Configurable Cookies and identifiers by default Often cookieless No measurement cookie, no cross-site tracking, aggregated statisticsMulti-site, multi-user Supported Accounts and properties Varies Several sites in one workspace, 1 member on Free, 3 included on Starter, unlimited on ProMigration checklistDecide why you are leaving. Cost, maintenance, complexity or privacy review: the reason decides what to replace. Inventory what you actually use. Reports opened, goals, custom dimensions, plugins, scheduled emails. Export historical data you need for comparisons. Matomo gives you more control over exports than most hosted tools, especially if you self-host. Rewrite a minimal tracking plan. Pages, sources, a few key events. See our analytics migration checklist. Map goals and events to the new tool's concepts, and keep UTM naming consistent. Run both in parallel for two to four weeks and compare trends, not exact counts. Plan what you lose. Plugins, tag manager, self-hosting and fine-grained customization may not exist in a lighter tool. Update your privacy notice and review other trackers on your pages.For the wider picture, read the GA, Matomo or lightweight analytics guide. If you are leaving GA4 instead, see our Google Analytics alternative guide. For vendor changes, see what former Piwik PRO Core users should verify, and for budgeting see is free analytics still viable. Why Pomelo Analytics If Matomo has become a project to run rather than a tool to read, Pomelo Analytics, the tool we build, takes the opposite approach: measure right, with nothing to host or maintain.Numbers you can trust. Every key metric is explained in the interface. Counts are exact; from 1 to 9 visits, Pomelo shows "< 10" rather than false precision, and an unknown value never appears as zero. A fair collection. Audience measurement with no measurement cookie and no cross-site tracking: the IP address is not kept in measurement data, and statistics are aggregated. The Campaigns option adds channels, UTM and conversions by source, with your visitors’ consent. All your sites in one view. One workspace for every site, with the right people and the right access. A fair price. Plans follow your scale (sites, events, members, history), starting with a free plan. Data hosted in Europe, on AWS Stockholm.Pomelo is built for European SMBs, B2B SaaS and digital teams that run several sites together. Access opens gradually: join the Pomelo Analytics waitlist. Sources Links checked on November 10, 2026.Matomo, pricing Matomo, user guides CNIL, cookies: solutions for audience measurement tools Google Analytics Help Center
- 02 Mar, 2026
Plausible vs Fathom vs Simple Analytics: a practical 2026 comparison
Plausible, Fathom and Simple Analytics sit in the same broad category: lightweight, privacy-first web analytics for teams that do not want the complexity of GA4 or an enterprise analytics suite. They are not interchangeable, though. The right choice depends on your traffic volume, team model, reporting needs, hosting expectations and internal privacy review. Prices and packaging change often. The prices below come from public vendor pages read on November 15, 2026; the other points come from pages checked on May 9, 2026. Always verify the current vendor page before buying. We build Pomelo Analytics, which appears at the end of this page: we are not a neutral party. The short version Choose Plausible if you want an established open-source product, a clean dashboard, a self-hosting route and detailed documentation around subscription tiers. Choose Fathom if you want a simple paid SaaS with a deliberately small feature surface and straightforward multi-site pricing. Choose Simple Analytics if you want a Netherlands-based product with a clearly documented privacy posture, simple reports and a free entry point within the vendor's published limits. Comparison table Prices are in the currency and billing period shown by each vendor, read on November 15, 2026.Criterion Plausible Fathom Simple AnalyticsEntry price $9/month (Starter), $14 (Growth), $19 (Business), billed monthly, at 10k monthly pageviews and events $15/month, billed monthly, up to 100,000 pageviews €20/month for the paid self-serve plan, billed monthly; slider from 100k to 2.5M pageviewsWhat the volume counts Pageviews and custom events, across all sites of a team Pageviews and custom events, across all sites "Data points", which the pricing page does not define furtherSites Starter: 1 site; Growth and Business: several sites 50 sites included; extra packs of 50 at $10/month Not stated for the paid plan; free plan: 5 websitesUsers Starter: no team members; Growth and Business: team members Not stated 1 user included, €20/month per extra userTrial or free plan 30-day trial, no card required 7-day trial, card required; no free plan Free plan for hobby sites: 1 month of history, badge requiredAnnual billing "2 months free" "2 months free" "2 months free"Self-hosting Community Edition available Not stated on the pricing page Not stated on the pricing pageOver the limit One month over: no action. Two months in a row: asked to upgrade; dashboards may be locked, collection continues Two months in a row: contacted; dashboard and API access may be paused, collection continues Annual billing: email notice, one week to raise the limit, or it is raised for you. Monthly billing: the price changes with usagePrivacy posture is a configuration question All three vendors position themselves around privacy-first analytics, but a vendor promise is not the same as your live setup. Your team still needs to document:what the script collects; whether events or campaign parameters add personal or sensitive context; retention periods; provider role and data-processing terms; transfers and hosting location; whether other trackers on the same site change the consent analysis.For each tool, distinguish baseline audience measurement from events, campaigns and other data added through configuration. Check the installation defaults and what changes when you enable additional capabilities. Pricing should be compared at your real volume Do not compare only entry prices, and do not compare volumes across tools as if they were the same unit: the table above shows three different ways of counting. Model the cost at your actual monthly pageviews, number of sites, number of users, retention needs and export/API expectations. For example, a tool that is cheaper at 10,000 monthly pageviews may be more expensive at 500,000. A self-hosted option may reduce subscription fees but add infrastructure, backup and maintenance cost. A plan with generous site limits may be cheaper for an agency than a plan priced per site. Reporting quality matters more than feature count The best analytics tool is the one the team actually reads. Before buying, ask the person who will use the dashboard every week to answer three questions from a trial account:Which acquisition sources are working? Which content or pages deserve action? Which conversions changed materially since last period?If the tool cannot answer those questions quickly, more reports will not fix the problem. Why Pomelo Analytics Plausible, Fathom and Simple Analytics all bring privacy-first measurement. Pomelo Analytics, the tool we build, adds one idea: measure right. Not more data, but numbers you can trust, read at a glance and share across several sites.Numbers you can trust. Every key metric is explained in the interface. Counts are exact; from 1 to 9 visits, Pomelo shows "< 10" rather than false precision, and an unknown value never appears as zero. A fair collection. Audience measurement with no measurement cookie and no cross-site tracking: the IP address is not kept in measurement data, and statistics are aggregated. The Campaigns option adds channels, UTM and conversions by source, with your visitors’ consent. All your sites in one view. One workspace for every site, with the right people and the right access. A fair price. Plans follow your scale (sites, events, members, history), starting with a free plan. Data hosted in Europe, on AWS Stockholm.Pomelo is in pre-launch and counts events, so its volumes do not compare directly with the pageviews above. The launch grid, excluding tax: Free (€0, 5 sites, 100k events per month, 60 days of history), Starter (€7 per month, 10 sites, 500k events, 24 months) and Pro (€24 per month, 50 sites, 3M events, 24 months); every plan includes every report. These plans are not yet open for public sign-up. Pomelo is built for European SMBs, B2B SaaS and digital teams that run several sites together. Access opens gradually: join the Pomelo Analytics waitlist. For other comparisons, see the general guide to Google Analytics, Matomo and lightweight tools, the Google Analytics alternative and the Matomo alternative. Sources Prices read on November 15, 2026; the privacy and feature pages were checked on May 9, 2026.Plausible, subscription plans Plausible, data policy Fathom, pricing Fathom, features Simple Analytics, pricing Simple Analytics, what we collect
- 19 Jan, 2026
Stop Sending PDF Reports Your Clients Don't Read
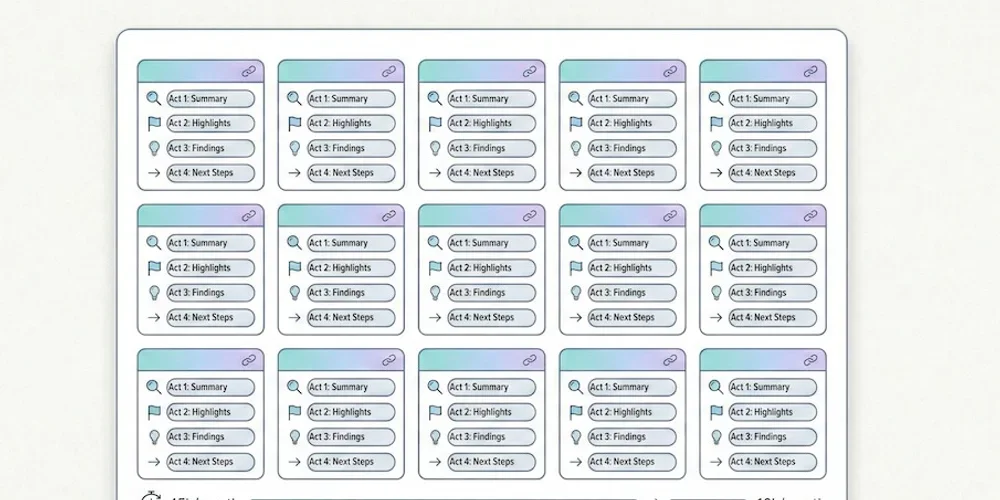
It's the end of the month. For every freelancer or project manager at an agency, it's time for the dreaded ritual: monthly reporting. You export PDFs from Google Analytics, take screenshots, add three comments in an email, and hit send. Time spent: 2 to 4 hours. The reality? Your client opens the PDF, glances at the first chart, has no idea why the "Engagement Rate" dropped by 0.4%, and closes the document. You've lost half a day. And they didn't perceive the value of your work.1. The Problem with "Accounting-Style" Reports Why it doesn't work The classic mistake is trying to prove you've been working by showing lots of numbers. "Look, there are 45 pages of charts, so clearly I've been busy." But your client (often an SMB owner) isn't paying you for charts. They're paying for results and peace of mind. Sending them a complex report is like handing the problem back to them. They don't know what to do with it, and they end up questioning your usefulness. What the research says According to HubSpot's surveys on agency practices, reporting is consistently cited as one of the most time-consuming and least client-valued tasks. The paradox is cruel: the more time you spend on the report, the less it gets read, because its very length discourages reading. Research by Databox among marketing professionals shows that most clients want short, results-oriented reporting, not exhaustive audits. The most satisfied clients are those who receive a summary of 5 to 10 metrics maximum, accompanied by a clear recommendation. → Sources: HubSpot - State of Marketing Report, Databox - Reporting Best Practices2. The Method: Less Data, More Story For a report to be read, understood, and appreciated, it needs to tell a simple story in 4 acts. This is Data Storytelling applied to client reporting. Act 1: The "One-Liner" (The Weather Report) Start your reporting email with a single sentence that summarizes the month. Your client should understand the trend without opening any attachment.Bad: "Here are this month's statistics." Good: "Record month for traffic (+20%), but slight dip in qualified leads, we know why and we're fixing it."This sentence is the ultimate test. If you can't summarize the month in one line, you haven't found the insight yet. Go back to the numbers. Act 2: The 3 Macro KPIs (The Dashboard) Don't include everything. Only show the goals defined at the start of the contract, and report on progress. Three metrics are enough in the vast majority of cases. For a brochure site or blog, these are typically the 5 essential KPIs, but in client reporting, condense further: total traffic, number of leads/sales, and the "star metric" of the month (the one that moved the most, for better or worse). Present these numbers with comparison to the previous month and the target. A 3-row table beats a 40-page PDF every time.Metric Target Last Month This Month TrendUnique visitors 5,000 4,200 5,100 ✅ +21%Form submissions 30 28 22 ⚠️ -21%Cost per lead (if Ads) < $15 $12 $18 ❌ +50%Act 3: "What We Did" → "What It Produced" This is where you sell your work, but by connecting it to results, not listing tasks.Bad: "We published 4 blog posts, optimized 3 pages, and adjusted keywords." Good: "The GDPR article (published on the 15th) generated 450 qualified visits from LinkedIn → 8 form submissions. The 3 optimized pages moved from page 3 to page 1 for their target keywords."The principle is to systematically link the action to the impact. If an action hasn't produced measurable results yet, say so honestly ("impact expected in 4-6 weeks, we're monitoring"). Act 4: The Plan for Next Month This is the most important part, and the most often forgotten. A report shouldn't just look in the rearview mirror. It should sell what's next."Since LinkedIn traffic is growing (+40% over 2 months), next month we'll double the posting frequency." "The drop in leads is coming from a form that's too long (5 fields instead of 3). We're simplifying it next week."This final act reassures your client about two things: you understand what's happening, and you have a plan. That's what builds loyalty, far more than a 45-page PDF.3. Before/After: Same Month, Two Reports To make the method concrete, here's the same period presented two ways. ❌ The "Accounting" Report (What You Might Be Doing)3-line email ("Here's this month's report, let me know if you have questions"). 38-page PDF attached, exported from GA4. Uncommented charts: bounce rate, session duration, user flows, demographic reports. Production time: 3.5 hours. Reading risk: the main conclusions may be missed in a lengthy attachment. Client perception: "I don't understand, but I suppose things are fine."✅ Reporting that measures right: the 4-act methodStructured email of 15 lines maximum (One-Liner + 3 KPIs + Actions/Results + Plan). A 3-5 row table embedded in the email (no attachment). Optional: a link to a shared real-time dashboard (Plausible, Fathom, etc. allow this). Production time: 45 minutes. Reading benefit: the main conclusions are visible without opening an attachment. Client perception: "My agency has things under control. They understand my business."The gain is triple: you spend 3x less time, the client understands 10x better, and your perceived value increases. That's a virtuous cycle.4. Your Tool Shapes Your Report There's a reason the "Accounting" report persists: the tool produces it. Google Analytics generates multi-page PDF reports because it has dozens of reports. When your tool is an overengineered machine, your reporting inherits that complexity. The reverse is also true. When your analytics tool shows a dashboard that fits on one screen (visitors, sources, top pages, conversions), your reporting flows naturally from it. You don't export 40 charts: you take a screenshot and comment on it. This is one of the strongest arguments for switching to a lightweight analytics tool when managing multiple clients: reporting time drops mechanically because there's nothing to "filter." The tool only shows what matters. Some solutions (Plausible, Fathom) even offer read-only shareable dashboards: you give your client a link, they can check their stats whenever they want, without bothering you. The monthly report then becomes a strategic commentary email, not a data export.5. The Multi-Client Challenge For an agency or freelancer managing 10, 20, or 30 sites, the reporting problem multiplies. Spending 3 hours per client = 30 to 90 hours per month of pure reporting. That's unsustainable, and it's time you're not spending on strategy, execution, or acquiring new clients. The solution comes from three levers:Standardize the format. Use the same 4-act template for all clients. Only the numbers change. Create a reusable email template with placeholders for the One-Liner, the 3 KPIs, the Actions/Results, and the Plan. Once the structure is muscle memory, you'll fill it in 20 minutes per client. Choose a multi-site tool. Lightweight tools typically let you manage all your clients from a single interface, with one dashboard per site. The analytics comparison guide details site limits by plan. Being able to switch between clients in one click (instead of logging into separate GA4 accounts) is a massive time-saver. Automate the sharing, not the analysis. Instead of exporting PDFs, share a link to the real-time dashboard and send a strategic commentary email. The client has 24/7 access to the numbers, and your value-add is in the analysis, not the extraction. This also reduces "where are my stats?" emails between reporting cycles.The compounding effect When you standardize reporting across 15 clients and switch to a lightweight tool with shareable dashboards, the math changes dramatically. Instead of 15 × 3 hours = 45 hours/month, you're looking at 15 × 40 minutes = 10 hours/month. That's 35 hours reclaimed, nearly a full work week, that you can reinvest in billable work, business development, or simply not burning out. More importantly, your clients get better reporting. A 10-line email they actually read beats a 40-page PDF they ignore. Your retention improves because clients feel understood, not buried under data they didn't ask for.Conclusion: Sell Intelligence, Not Spreadsheets A good analytics tool shouldn't serve as a PDF generator. It should help you find the insight (the key trend, the opportunity, the red flag) that you'll share with your client in 3 sentences. If your tool is too complicated, you spend your time searching for data. If it's simple, you spend your time analyzing it. That analysis is what justifies your fee, not the number of pages in the PDF. In 2026, an agency's value is no longer in extracting data. It's in translating data into business decisions. And for that, you need to start by measuring only what matters.FAQ: Client Reporting How much time should I spend on monthly reporting per client? With the 4-act method, plan for 30 to 60 minutes per client. If you regularly exceed 2 hours, it's a signal that your analytics tool is too complex or that you haven't standardized your format. The goal is for time spent analyzing to exceed time spent extracting. Should I fully automate reports? No. Full automation (scheduled exports, auto-sent emails) produces noise. Your client receives a PDF without context and doesn't know what to do with it. The ideal is a hybrid: data is accessible automatically (shared dashboard), and your value-add is the monthly strategic commentary, which you write yourself. Which KPIs should I show an e-commerce client? For e-commerce, the 3 macro KPIs are: revenue generated by the site, conversion rate (visitors → buyers), and customer acquisition cost (if running ads). Everything else is operational detail you manage internally. Your client wants to know how much the site earned, not how many people clicked "Add to Cart." My client insists on a detailed GA4 report. What should I do? Educate them gradually. Send the 4-act format alongside the PDF they're asking for. After 2-3 months, ask which one they actually read. In most cases, they'll admit they only read your email, and you can then drop the PDF.

Just the right measure, for all your websites.
Pomelo is opening gradually. Join the first teams measuring right and help shape what comes next.